AI Observability and Monitoring: How to Keep AI Reliable in Production
10 min readUpdated August 10, 2026
Prince OkonSenior Data Scientist
Your AI chatbot has 99.9% uptime, no infrastructure alerts, and enviable latency. Yet customers are receiving wrong answers, finance has noticed AI costs doubling, and support agents quietly override its responses every day. No dashboard reports a problem, because technically nothing is broken.
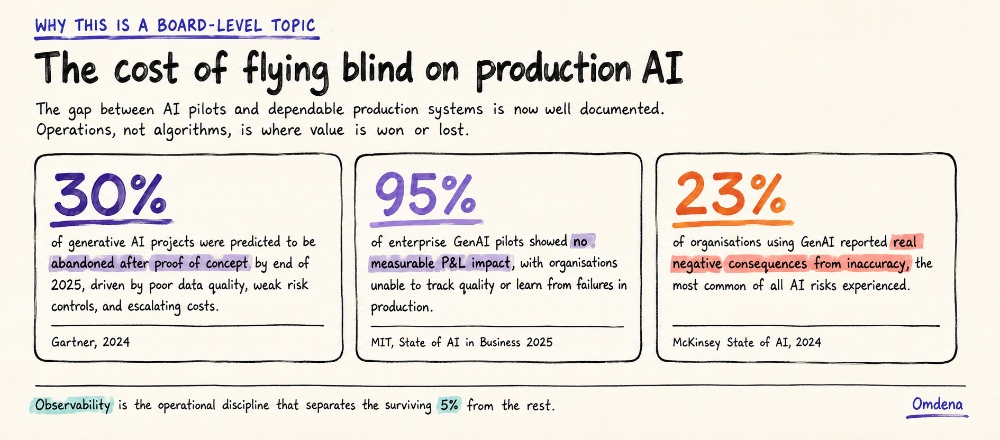
This is how production AI fails: not loudly, like a crashed server, but silently, while every classic metric stays green. Gartner predicted 30% of generative AI projects would be abandoned after proof of concept, and MIT found 95% of enterprise pilots deliver no measurable return.
This article explains AI observability and monitoring: what they are, why traditional monitoring cannot catch silent failures, the four pillars that make AI behaviour visible, exactly what to monitor across models, prompts, retrieval pipelines, and agents, and the proven practices that keep AI reliable and trustworthy long after the launch applause fades.
What Is AI Observability and Monitoring?
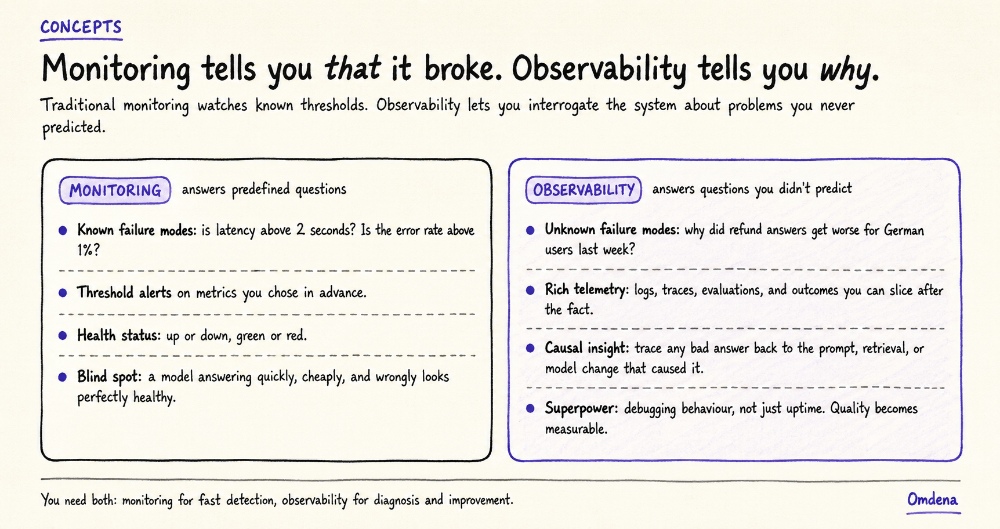
Monitoring is the discipline you already run: tracking predefined infrastructure signals such as CPU, memory, availability, error rates, and latency, and alerting when a threshold is crossed. It answers questions you knew to ask in advance, and it keeps systems up.
Observability goes further. It is the ability to understand system behaviour and find root causes from rich telemetry, including questions nobody predicted. Why did refund answers get worse for German-speaking users last Tuesday? No pre-built alert covers that; correlated telemetry does.
Figure 1. Monitoring detects known failures; observability explains unknown ones.
The two are complements, not competitors. Monitoring gives you fast detection of known conditions; observability gives you diagnosis and understanding when something unprecedented happens. Mature teams run both on the same telemetry: logs, metrics, traces, and AI evaluations feeding dashboards and investigations alike.
AI observability extends traditional observability for one deep reason: AI outputs are probabilistic, not deterministic. The same input can produce different answers, and “working” is a matter of degree. So beyond infrastructure health, AI systems need quality signals about the answers themselves. That need becomes obvious once you see how AI actually fails.
Why Traditional Monitoring Isn’t Enough for Production AI
Traditional software is deterministic. When it breaks, it crashes, throws exceptions, or times out, and your alerting catches all three. AI breaks differently: it returns a confident 200 OK response containing a hallucination, and nobody notices.
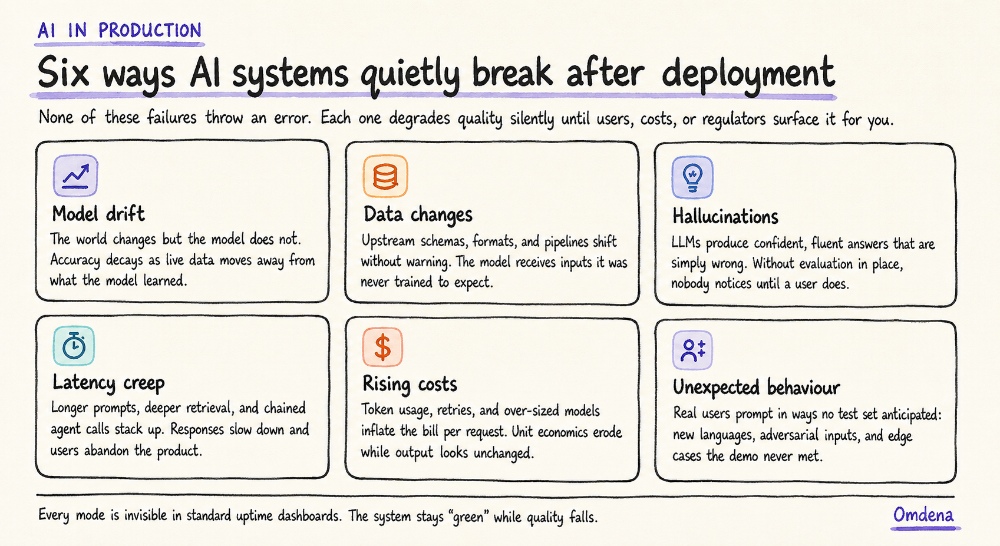
These silent failures take recognizable forms, and none of them appears on an uptime dashboard:
Figure 2. Six silent failure modes that keep every classic dashboard green.
Alongside these, teams routinely meet prompt regressions after “harmless” edits, compliance violations in generated text, agent loops burning tokens, and business decisions made on incorrect outputs. A Canadian tribunal ordered Air Canada to compensate a passenger after its chatbot invented a refund policy, as reported by the BBC.
Agents raise the stakes further. A chatbot that hallucinates misinforms one user; an agent that hallucinates then calls tools, moves records, and triggers workflows, spreading one wrong belief across several systems before any human looks up.
The core distinction is worth memorising: traditional monitoring detects system failures, while AI observability detects decision failures. The cost of missing the second kind is now well documented.
Figure 3. What flying blind costs: analyst findings on production AI failure.
McKinsey reports 23% of organisations have already suffered real negative consequences from generative AI inaccuracy. Catching decision failures requires telemetry designed for AI, which is exactly what the four pillars provide.
The Four Pillars of AI Observability
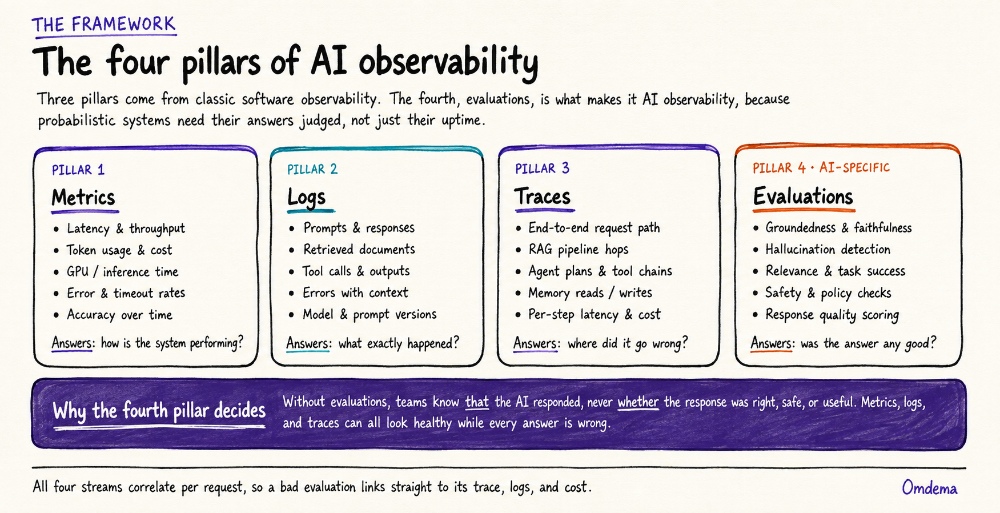
Classic observability rests on metrics, logs, and traces. AI observability keeps all three, aims them at new targets, and adds a fourth pillar that changes everything: evaluations.
Figure 4. Metrics, logs, and traces inherited from software; evaluations added for AI.
Metrics quantify performance and economics: latency, token usage, cost per request, GPU utilisation, and accuracy trends.
Logs capture the raw record: every prompt, response, retrieved document, tool call, and error with full context.
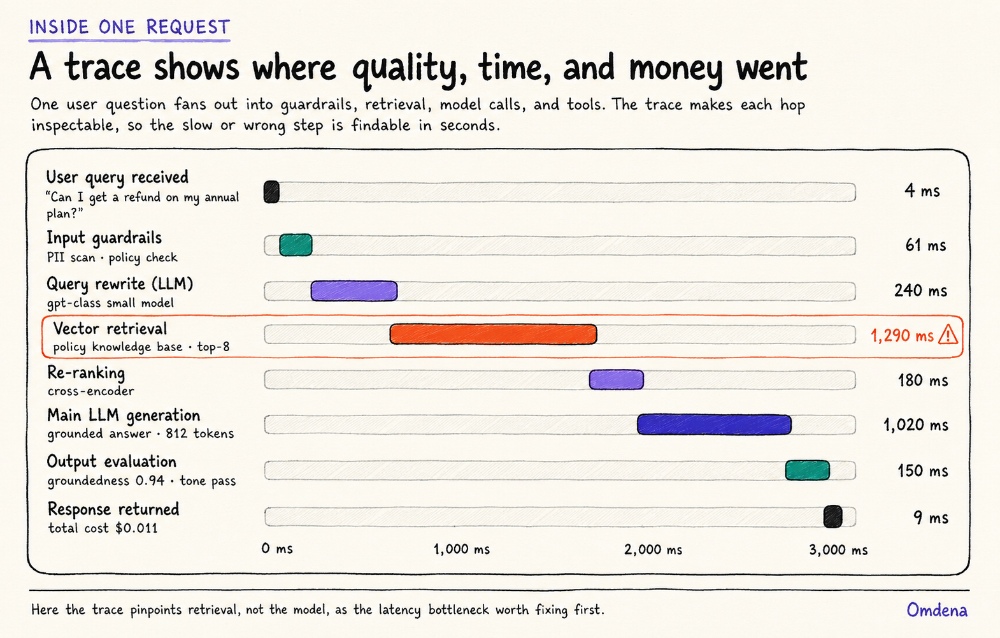
Traces stitch those records into the journey of a single request across the whole workflow: RAG retrieval, agent planning, tool chains, and memory. In pipeline architectures, the slow or wrong step is rarely where you assume.
Figure 5. A traced RAG request: retrieval, not the model, is the bottleneck here.
Evaluations are where AI differs. Automated scoring of groundedness, hallucination, faithfulness, relevance, safety, and task success runs continuously against production traffic. Without evaluations, organisations know that the AI responded, but never whether the response was actually good.
In practice, evaluation programmes combine three methods: automated checks such as LLM-as-judge scoring on live traffic, curated golden sets replayed against every release, and periodic human calibration to keep the automated judges honest. The mix matters less than the habit: quality is measured continuously, not assumed from launch benchmarks.
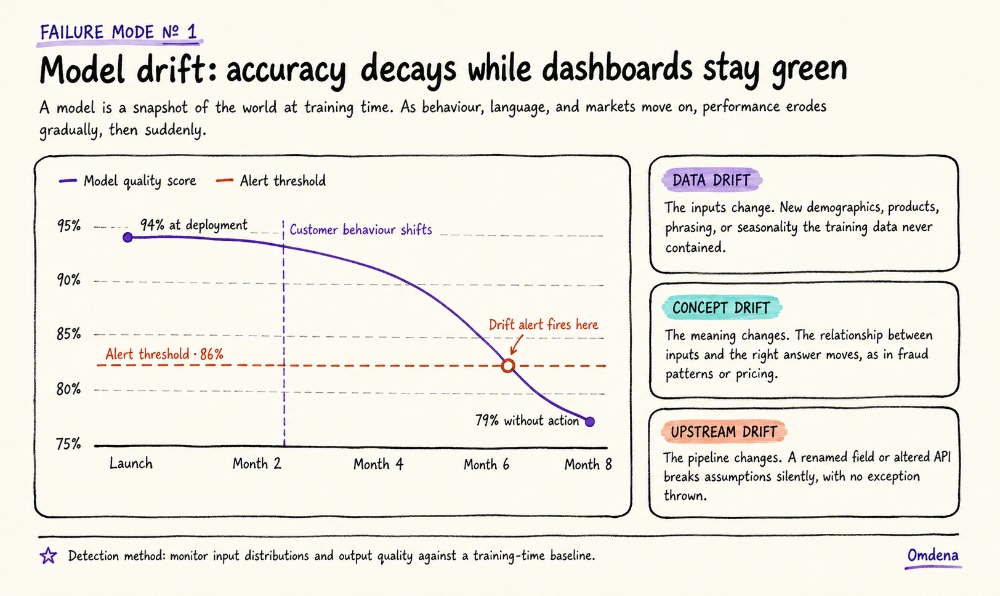
Evaluations are also your drift detector. Because models are snapshots of the world at training time, quality decays as behaviour, language, and markets move on. Continuous scoring against a baseline turns that decay into an alert instead of a quarterly surprise.
Figure 6. Drift in action: quality decays while uptime stays perfect.
With the four pillars in place, the practical question becomes what, specifically, to point them at.
What Should You Monitor in Production AI?
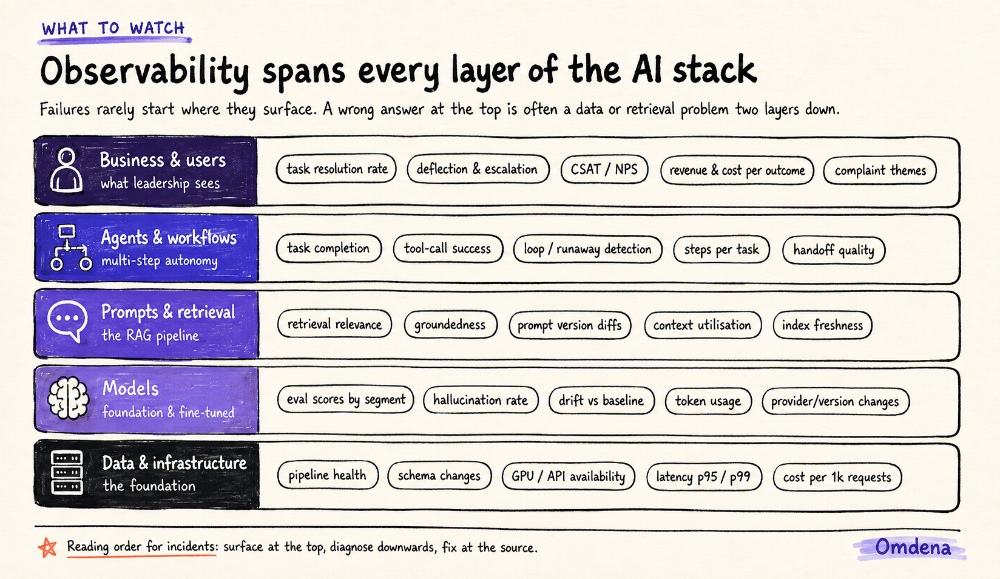
Failures rarely start where they surface: a wrong answer at the top is often a stale index or schema change two layers down. Effective coverage therefore spans six categories, from infrastructure to business outcomes.
Figure 7. The production monitoring stack: surface at the top, diagnose downwards.
Infrastructure health: latency, availability, GPU and memory pressure, and failure rates. Necessary, but only the floor.
Model performance: token usage, response times, and behaviour across model and prompt versions, so regressions are attributable.
Output quality: hallucination rate, groundedness, accuracy, relevance, and confidence, scored by the evaluation pillar.
Retrieval performance: for RAG, retrieval relevance, source freshness, embedding quality, and citation accuracy.
Agent behaviour: tool usage, planning quality, loop detection, task completion, and escalation rates for AI agents.
Business metrics: user satisfaction, resolution rate, cost per interaction, human overrides, and the KPIs the system exists to move.
Version tracking runs through all six categories. Every metric should be sliceable by model version, prompt version, and index snapshot, because the first question in any incident is “what changed?”. Teams that cannot answer it in one query end up debugging by folklore.
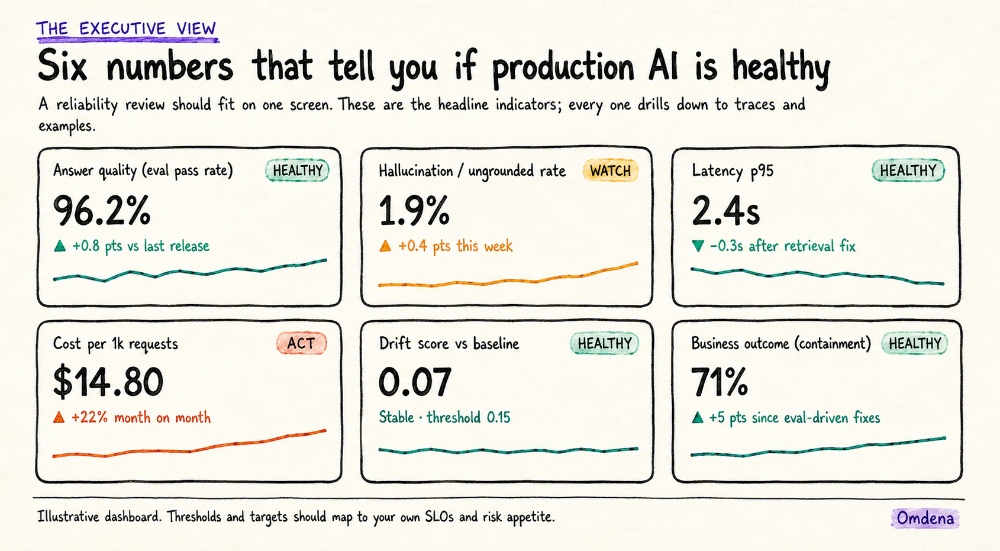
The last category deserves special emphasis, because it is the one leadership actually reads. A reliability review should fit on one screen and still drill down to real traces when challenged.
Figure 8. An illustrative executive view: six indicators, one screen.
Note the mix: quality and safety alongside latency and cost, anchored by a true business outcome. Human overrides are a particularly honest signal, because support teams route around a failing AI long before dashboards admit it. Knowing what to watch, the remaining question is how to run it.
Best Practices for Reliable AI in Production
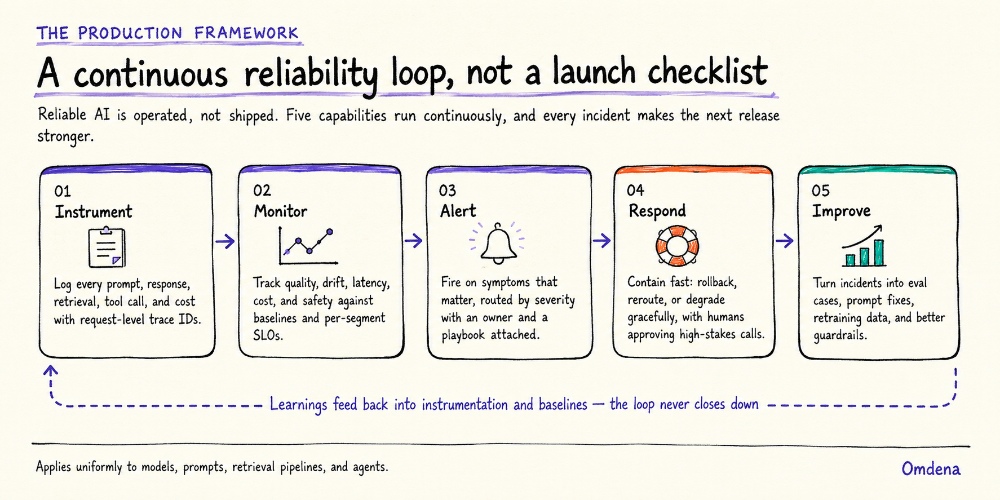
Observability is not a dashboard you install. It is a continuous improvement loop you operate, uniformly, across models, prompts, retrieval pipelines, and agents.
Figure 9. The continuous reliability loop that turns incidents into improvements.
Six practices separate teams that run this loop well from teams that burn out:
Instrument the entire AI workflow from day one, not just the model. Retrofitting telemetry after an incident costs far more.
Combine monitoring with continuous evaluations, so quality is measured on live traffic, not assumed from launch benchmarks.
Alert on quality degradation, not only latency: a drop in groundedness deserves a page as much as a slow endpoint.
Monitor costs alongside performance, per request and per outcome, so unit economics never silently erode.
Keep humans reviewing critical failures, with clear authority to pause a capability or roll back.
Continuously refine prompts, retrieval, and workflows from production data, turning every incident into permanent regression evals.
Anchor the whole loop to business outcomes. An observability programme that improves eval scores while resolution rates fall is optimising the wrong thing; tie every quality metric to the KPI it is supposed to move, and review them together.
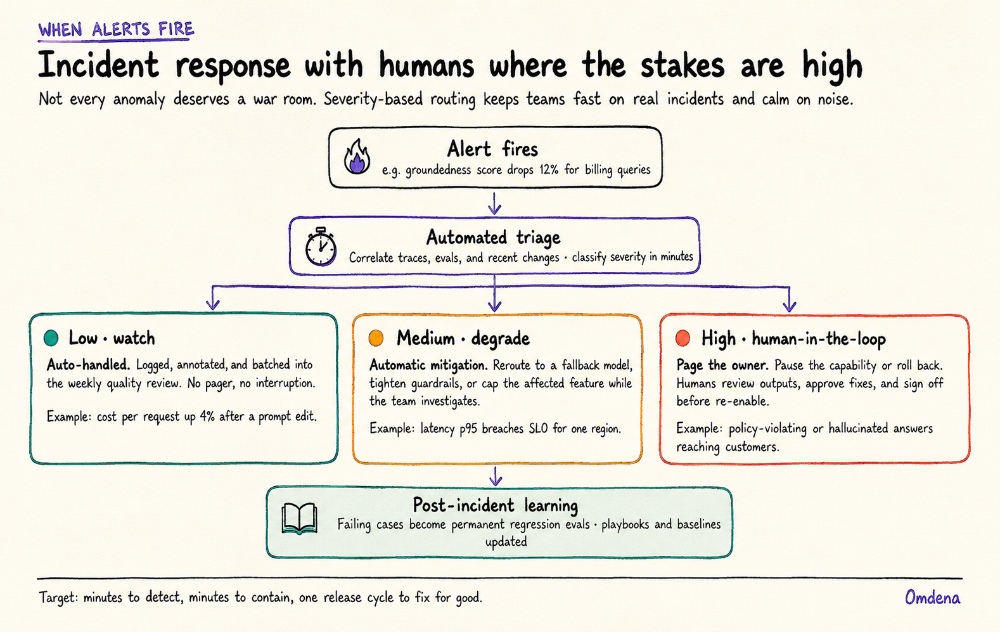
Alert routing is where the loop most often breaks in practice. Severity-based triage keeps humans focused on incidents that deserve attention and lets automation absorb the rest.
Figure 10. Severity-routed incident response, with humans on the highest-stakes path.
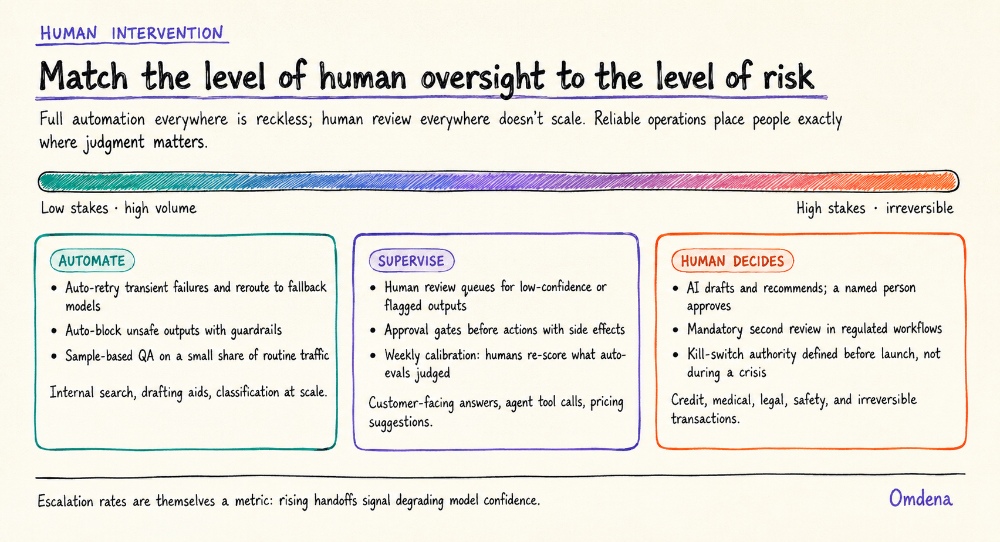
The same logic governs everyday operation: match the depth of human oversight to the stakes of the decision, and treat rising escalation rates as telemetry about degrading confidence upstream.
Figure 11. Matching human oversight to risk, from full automation to human sign-off.
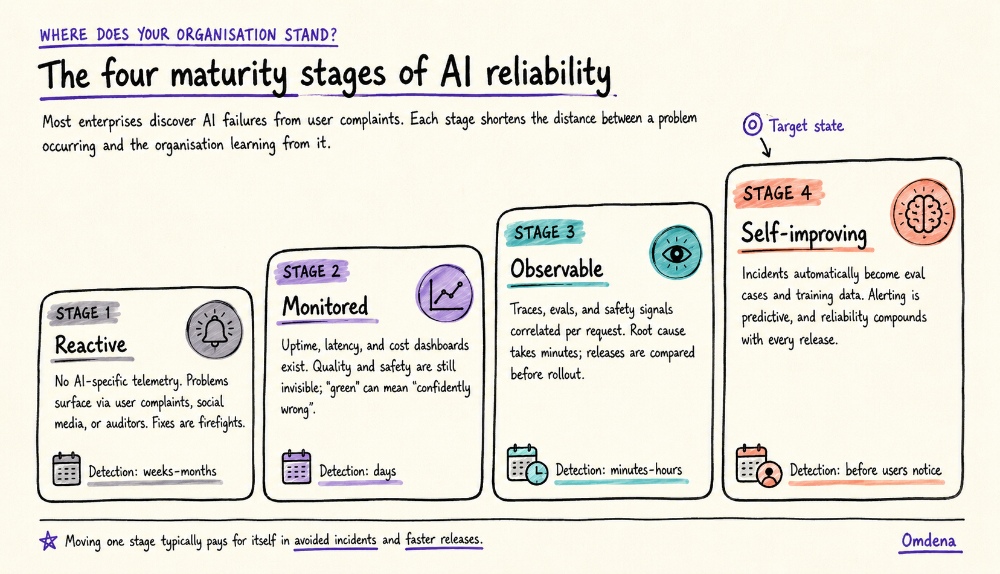
Run honestly, these practices compound. Organisations tend to climb four recognisable stages, and knowing your stage makes the next investment obvious.
Figure 12. Four maturity stages, from complaint-driven firefighting to self-improving AI.
Most enterprises today sit between reactive and monitored: infrastructure dashboards exist, but answer quality is invisible. Closing that gap is where the right partner earns its keep.
How Omdena Helps Organizations Build Reliable Production AI
Many organizations can build an impressive AI prototype. Far fewer can operate AI reliably in production, and that gap is precisely where Omdena works. So far, it has delivered 600+ AI solutions for 300+ organizations across 60 countries.
For teams facing the challenges in observability and monitoring, Omdena helps to:
Design production AI architectures and deploy AI agents with observability built in, not bolted on.
Implement monitoring, tracing, and evaluation pipelines wired to your baselines, SLOs, and alerting playbooks.
Improve reliability and optimise AI costs using production data, from prompt regressions to retrieval quality.
Build internal capacity, so your teams can operate, debug, and continuously improve the system themselves.
That delivery approach runs on an in-house platform, which brings the same visibility to how AI systems are built.
How Umaku Enables AI Observability
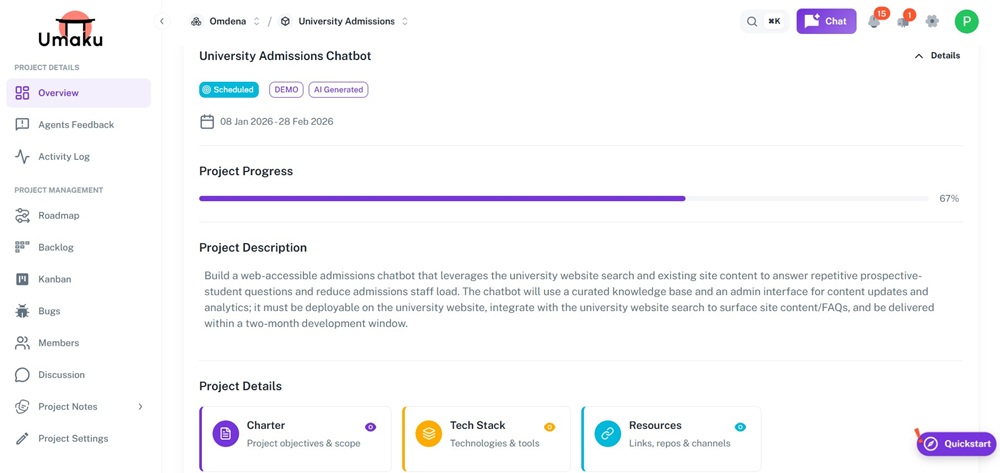
Reliable AI depends not only on monitoring models in production, but on understanding the context in which those systems are developed and maintained. Umaku, Omdena’s agentic delivery platform, is that context-aware operational layer, and the operating system behind every Omdena build.
Umaku connects delivery context, including project goals, sprint scope, and business requirements, to operational evidence:
Project Overview in Umaku
AI-assisted reviews on every commit check scope, code quality, DevOps practice, and bugs with citations, catching reliability risks at the source.
Continuous evaluation and LLM observability track cost, quality, and reliability of AI applications throughout delivery and beyond.
A shared project health dashboard gives engineers and executives one view of progress, risks, and production readiness.
Measured outcomes: Umaku reports 20–35% earlier risk detection across code, models, and workflows, and 15–25% less rework from late-stage quality issues.
The result: observability starts on day one of a build and hands over cleanly into production operations, instead of being retrofitted after the first incident.
Monitoring Keeps AI Running, Observability Keeps It Trustworthy
Organisations should not wait for customers, or regulators, to discover their AI failures. Production AI needs continuous visibility into performance, quality, safety, cost, and business impact, because the most expensive failures are the silent ones.
If you retain one habit, make it this: never ship an AI feature you cannot watch. Before the next launch, require five answers in writing:
Which five metrics tell us this system is healthy, and what are their thresholds?
Can we trace any single bad answer back to its cause within an hour?
What fires an alert on quality, not just latency, and who owns the playbook?
Which decisions require a human, and how do users reach one?
How does last month’s worst failure become this month’s regression test?
Monitoring keeps systems available. Observability keeps AI trustworthy. Organisations that invest in it early deploy faster, carry less operational risk, and earn the confidence to scale AI across the business. The rest keep flying green dashboards into silent failures.
FAQ
What is AI observability?
AI observability is the ability to understand and diagnose the behavior of AI systems using telemetry such as logs, metrics, traces, and continuous evaluations. Unlike traditional observability, it also measures AI-specific signals such as hallucinations, groundedness, relevance, safety, and task success.
What is the difference between AI monitoring and AI observability?
AI monitoring tracks predefined signals and alerts teams when known conditions cross a threshold, while AI observability helps teams investigate and understand unexpected behavior using rich telemetry. Monitoring helps detect known problems, while observability helps identify the root cause of unfamiliar AI failures.
Why is traditional monitoring not enough for AI systems?
Traditional monitoring can show that an AI system is available and responding, but it may not detect incorrect or unsafe outputs. AI systems can return a successful response while producing hallucinations, stale information, poor retrieval results, or costly agent behavior. AI observability adds quality and evaluation signals to make these silent failures visible.
What should you monitor in production AI?
Production AI should be monitored across infrastructure health, model performance, output quality, retrieval performance, agent behavior, and business metrics. Key signals include latency, token usage, hallucination rate, groundedness, retrieval relevance, tool usage, task completion, user satisfaction, human overrides, and cost per interaction.
What are the key pillars of AI observability?
The four key pillars of AI observability are metrics, logs, traces, and evaluations. Metrics measure performance and economics, logs capture the detailed record of AI interactions, traces connect the steps within an AI workflow, and evaluations continuously assess the quality, safety, relevance, and reliability of AI outputs.
Continue with Omdena
Share this article
Share on LinkedIn, send by email, or copy the direct link.