3D Roof Reconstruction with AI: How Computer Vision Automates Solar PV Design — Omdena Case Study
17 min readUpdated May 25, 2026
Omdena
Every solar PV project starts with the same engineering task: map the roof in three dimensions before simulation can begin. A designer needs tilt, orientation, height, and area for every plane. On industrial buildings with a dozen distinct surfaces, it takes a full working day before a single contract is signed. This project set out to automate it entirely.
Executive Summary
Omdena built an end-to-end computer vision pipeline that automatically reconstructs 3D roof geometry from aerial imagery and point cloud data. The dataset covered real industrial and commercial rooftops: two-sided, sawtooth, diagonal, and flat building types, sourced from Google, SIGPAC, and Bing, then processed through Digital Surface Models.
The pipeline solves three problems in sequence: detecting roof boundaries in aerial images, classifying rooftop surfaces in point cloud data, and estimating geometric attributes for each identified roof plane. YOLOv11 instance segmentation combined with SAM2 produced pixel-accurate boundary contours across varied building orientations, sizes, and roof configurations.
PointNet with a T-Net spatial alignment module achieved approximately 80% validation accuracy on point cloud segmentation. EfficientNetB0 was selected over ResNet50 for attribute estimation after direct comparison, producing better spatial coverage across all four outputs: tilt, azimuth, height, and perimeter per identified roof plane.
Three mesh reconstruction methods were evaluated: Poisson Surface Reconstruction, MeshAnythingV2, and Marching Cubes. Poisson proved too resource-intensive and noise-sensitive for real-world data. Marching Cubes was selected for its robustness and absence of hardware dependencies, delivering structured 3D geometry per plane ready for direct use in PV design tools.
KEY FINDINGS
~80% point cloud accuracy
PointNet validation accuracy classifying rooftop points from surrounding structures across a purpose-built dataset of real industrial and commercial rooftops
EfficientNetB0 selected
outperformed ResNet50 on spatial plane coverage for tilt, azimuth, height, and perimeter prediction per identified roof plane
Three mesh methods compared
Poisson Surface Reconstruction, MeshAnythingV2, and Marching Cubes were evaluated; Marching Cubes were selected as the most robust for real-world data
Industrial rooftop dataset
two-sided, sawtooth, diagonal, and flat building types from three aerial imagery sources: Google, SIGPAC, and Bing
3x data augmentation applied
rotation, zoom, brightness variation, and horizontal flip are used to compensate for sparse cleaned data while preserving structural integrity
Four attributes per roof plane
tilt, azimuth, height, and perimeter predicted automatically, serving as direct inputs for PV simulation and panel placement software
The Bottleneck Before Every Solar PV Project
The solar PV design process has a problem upstream of everything else: before simulation runs, before panel layout is optimised, before a mounting system is specified, someone has to build a 3D model of the roof. For a flat industrial shed, that is manageable. For a commercial building with multiple roof levels, sawtooth profiles, and protruding structures, the work can take a full working day or more.
The manual process requires tracing roof perimeters from aerial photographs, estimating heights from site visit notes, and entering tilt and azimuth values for each plane. Every number entered by hand is an opportunity for error, and errors here propagate downstream.
A roof plane recorded at 20 degrees instead of 25 degrees changes the panel yield calculation, the structural load estimate, and the inverter sizing. These are cascading corrections that could have been avoided with accurate geometry from the start.
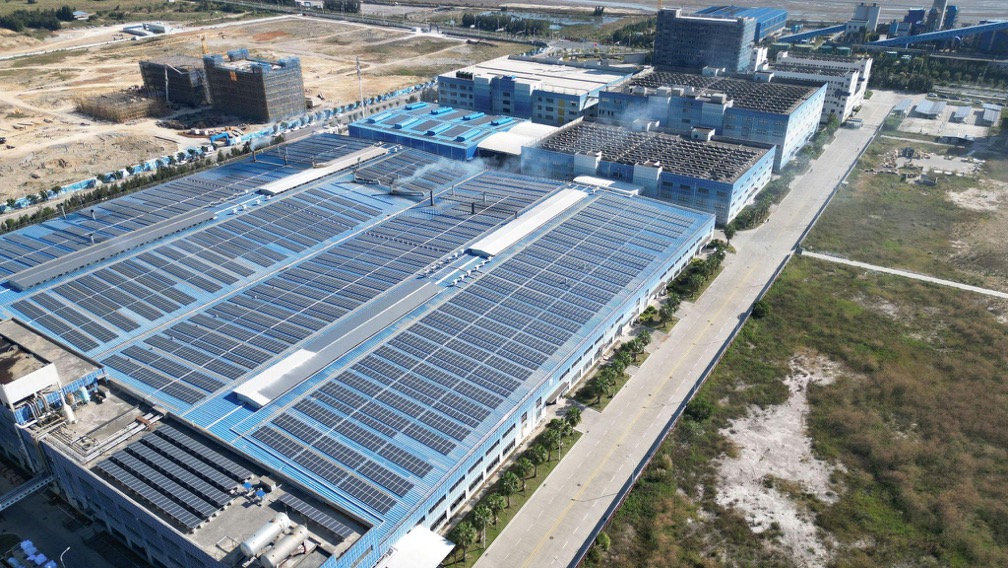
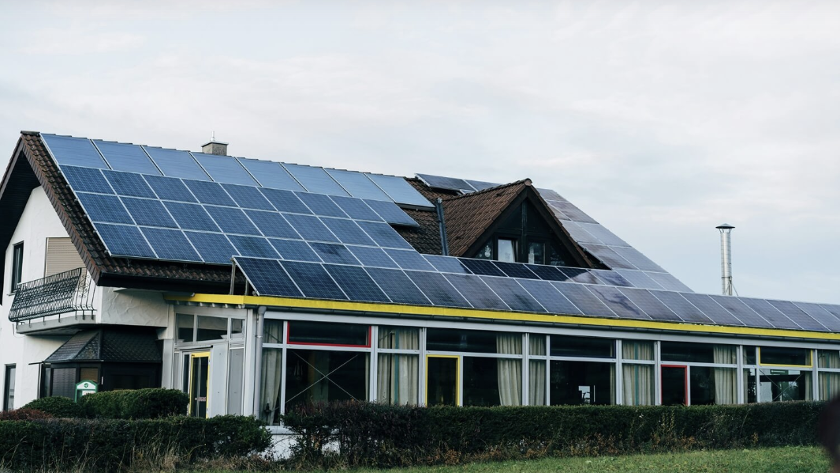
Figure 1: The starting point for every solar installation, a rooftop that needs to be modelled in three dimensions before a single design decision can be made.
The problem scales badly. A solar company assessing fifty commercial buildings across a region cannot afford to model each one before knowing which are worth pursuing. That triage step should take hours, not weeks. As long as 3D roof modelling requires sustained effort per building, the pre-sales bottleneck is structural: it limits how many opportunities a company can evaluate and how quickly it can respond to enquiries.
The Data: Purpose-Built for Industrial Rooftop Geometry
The dataset was purpose-built from real industrial and commercial buildings. The focus was deliberate: these structures present geometric complexity, including multiple roof planes, varying heights, and sawtooth profiles, which makes manual modelling both expensive and error-prone. Residential buildings were excluded as their structural conventions would require separate treatment.
Each rooftop record combined three data types. Aerial images were sourced from Google, SIGPAC, and Bing. Using three independent sources introduced natural variation in resolution, angle, and lighting, making the trained models more robust to the imagery they would encounter in real deployment.
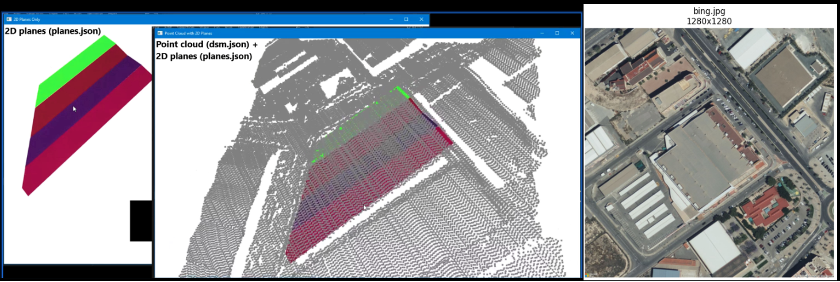
Point cloud data came from Digital Surface Models, encoding the 3D coordinate structure of each roof surface as a dense field of XYZ measurements. Plane metadata captured the imuth direction, height, tilt from the vertical, and perimeter vertices for each identified roof section.
Figure 2: Three-way data representation for a single industrial rooftop: coloured 3D planes (left), the corresponding point cloud in the spatial context (centre), and aerial imagery georeferenced to the same location (right).
Cleaning proceeded in two stages: visual compliance checks that discarded off-centre buildings, out-of-scope roof types, and images too incomplete for reliable annotation; then GPS-based registration checks that removed records where the 3D point cloud and 2D image did not reliably align. This reflects a recurring reality in geospatial projects: clear guidelines are necessary but not sufficient at scale. Interpretation drift must be caught programmatically, not corrected retrospectively.
The cleaned dataset was smaller than the raw collection, typical of real geospatial data rather than curated benchmarks. To compensate, 3x data augmentation was applied: rotation, zoom adjustment, brightness scaling between 0.8 and 1.2, width and height shifts of 10%, shear at 5 degrees, and horizontal flipping. Point cloud and plane data were duplicated alongside each augmented image, preserving structural correspondence across data types.
The Pipeline: From Aerial Image to 3D Geometry
Automating 3D roof reconstruction requires solving three distinct problems in sequence. Errors compound if any stage performs poorly, because each stage takes the previous stage’s output as its input. The diagram below shows the full pipeline from raw inputs to structured geometric output.
INPUT: Aerial Imagery + Digital Surface Model (Point Cloud)
OUTPUT: Structured 3D Roof Geometry → Ready for PV Design Software
The sections that follow explain what each stage does, why each modelling decision was made, and what the output of each stage looks like in practice.
Stage 1: Detecting and Outlining Roof Boundaries
Roof boundary detection is an instance segmentation task: the model must identify the presence of roofs and draw precise masks around each surface, distinguishing between separate buildings and sections of the same building. YOLOv11 instance segmentation was selected for this task.
The model was fine-tuned on the annotated roof dataset using an 80/20 training-validation split. Roof outlines were extracted from plane annotations, scaled and normalised into YOLO format, and used as training labels. When multiple planes existed on the same roof, they were merged into a single perimeter before the attribute estimation stage.
The detector produces bounding boxes around identified rooftops: sufficient for locating buildings but not precise enough for geometric analysis. SAM2 was integrated as the second step. Bounding boxes were passed to SAM2 as spatial prompts, and SAM2 returned pixel-accurate masks that included irregular edges and architectural features that bounding boxes alone would miss.
To reduce the annotation burden, AutoDistill was used with GroundingDINO and SAM to generate labels from raw aerial images before training automatically. This allowed the team to expand the annotated dataset without hand-labelling every image.
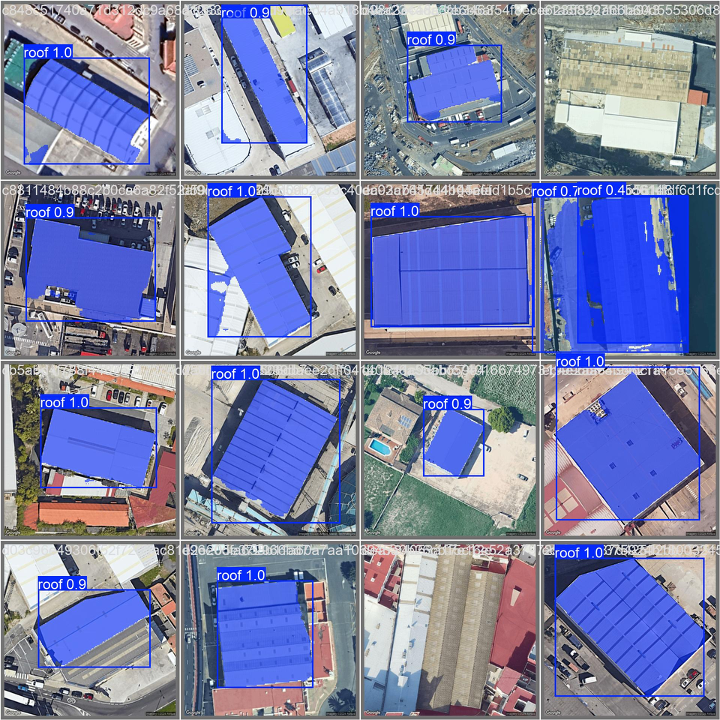
Figure 3: YOLOv11 inference results across a sample of industrial rooftops from the validation set. Detection confidence scores of 0.9 and 1.0 across different building orientations, sizes, and roof types demonstrate consistent model performance.Figure 4: SAM2 segmentation applied to two large industrial warehouses. The blue masks show pixel-accurate roof boundaries produced from YOLOv11 bounding-box prompts, capturing irregular edges and roof features that bounding boxes alone would miss.
Stage 2: Processing the Point Cloud
Once the roof boundaries are identified, the corresponding point cloud must be segmented to isolate the rooftop surface from the rest of the Digital Surface Model. A real-world industrial point cloud contains surrounding ground, nearby structures, vegetation, and measurement noise. The segmentation step extracts only the roof points before they are used for attribute estimation or 3D reconstruction.
PointNet was selected for its T-Net module, a spatial transformer network that learns an affine transformation to align point clouds into a canonical coordinate space before feature extraction. This alignment makes learned features invariant to the orientation in which the point cloud was captured, which is critical when data is collected from multiple positions and angles. The final model achieved approximately 80% validation accuracy, classifying roof versus non-roof points.
Stage 3: Estimating Roof Plane Attributes
With the roof surface segmented, the final modelling step predicts the four geometric attributes for each roof plane: tilt from vertical, azimuth, relative height, and perimeter. These are not derived analytically from the point cloud. They are predicted by a neural network that combines visual features from the aerial image with spatial features from the point cloud, because neither source alone provides a sufficient signal.
Two architectures were evaluated. EfficientNetB0 uses an efficient convolutional backbone to extract high-level image features at reduced computational cost. ResNet50 uses deep residual learning with 50 layers. In both cases, the point cloud input was downsampled to a fixed size using Farthest Point Sampling.
An initial cap of 8,000 points was tested, but 16,000 points gave substantially better geometric representation, while Farthest Point Sampling preserved structural integrity better than random sampling at that size. CNN-extracted image features were concatenated with the downsampled point cloud and then passed through a combined network that predicted the four attributes as continuous outputs.
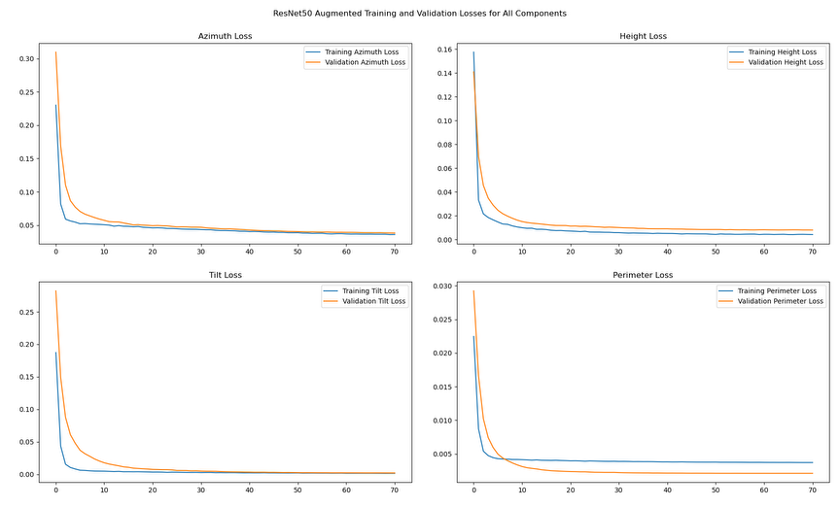
Training used weighted mean squared error loss with custom weights per attribute to reflect their different scales and downstream importance. EfficientNetB0 was selected: its loss curves showed consistent convergence across all four outputs, and its spatial coverage on ground-truth roof planes was substantially better than ResNet50’s.
Figure 5: Training and validation loss curves for the ResNet50 plane attribute estimation model across all four outputs: azimuth, height, tilt, and perimeter. Convergence across all curves confirms that the model was learning structured geometric relationships from the combined image and point cloud inputs.
Reconstructing the 3D Mesh: Three Methods, One Winner
Generating a 3D mesh bridges the gap between discrete point cloud measurements and a continuous surface that designers and simulation tools can use. Three reconstruction methods were evaluated, each making different assumptions about data quality and hardware. The choice matters significantly when working with real-world rather than controlled point clouds.
Poisson Surface Reconstruction
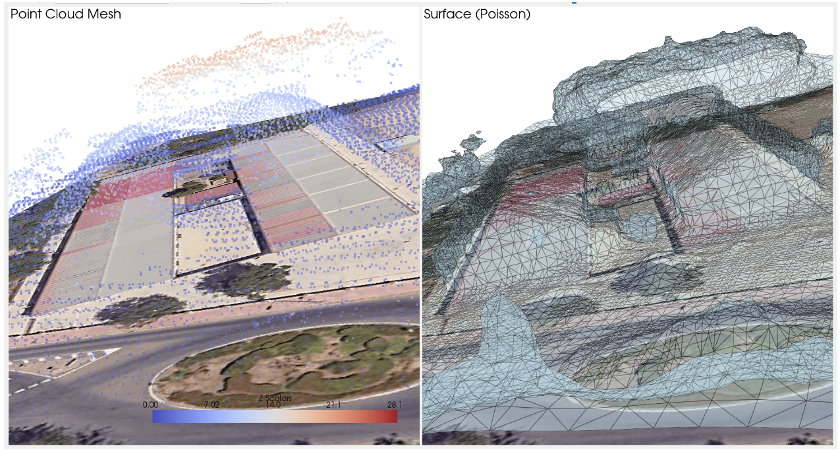
Poisson Surface Reconstruction estimates a smooth, watertight surface by solving a Poisson equation over the point cloud. In controlled conditions,t performs well. In practice, two problems emerged: the method requires a minimum of approximately 4,096 clean points, and real industrial rooftop data did not consistently meet this threshold after noise filtering.
The point clouds were also not fully isolated. Surrounding ground, adjacent structures, and vegetation were present in many records, and Poisson reconstruction is sensitive to such contamination. It also required an A100 GPU to run reliably, a hardware dependency unsuitable for most production deployments.
MeshAnythingV2
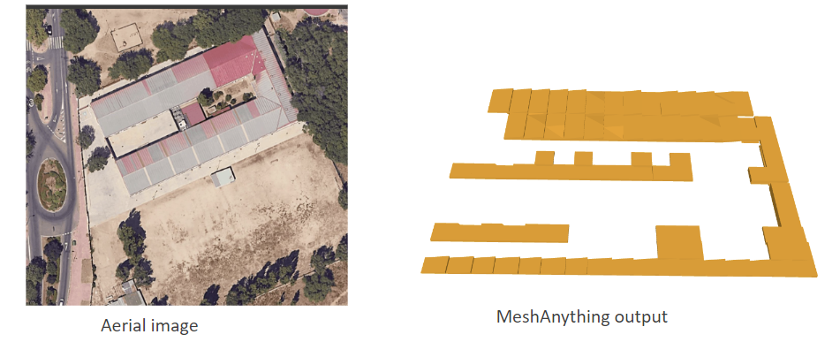
MeshAnythingV2 uses Adjacent Mesh Tokenization, representing mesh faces more compactly by using single vertices where possible rather than the conventional three. This produces better-structured output sequences and high-quality 3D meshes aligned to a given point cloud shape. The team explored it as a reconstruction approach, and it produced structured mesh outputs, as illustrated in the figure below.
Figure 6: MeshAnythingV2 output for an industrial warehouse. The aerial image (left) shows a complex multi-section rooftop; the generated 3D mesh (right) captures the stepped structure, demonstrating the model’s ability to reconstruct non-trivial roof geometry.
Marching Cubes: Selected
Marching Cubes was selected as the primary reconstruction method. The algorithm voxelises the 3D space into a grid of cubes, computes a scalar field encoding each voxel’s distance to the nearest point in the cloud, then extracts the iso-surface at a chosen threshold. A Gaussian filter is applied before extraction to smooth out noise and prevent surface artefacts caused by measurement irregularities.
Three practical advantages determined the selection. Marching Cubes has no minimum point count requirement. It handles noisy, incomplete data gracefully: the scalar field and Gaussian smoothing absorb measurement imperfections rather than propagating them into the final surface. It runs without specialised GPU hardware. And it outputs in PLY format, which is readable by standard 3D and engineering tools. For real-world industrial rooftop data, it was the most robust and deployable option.
Challenges and Engineering Decisions
Working with real geospatial data across a team of collaborators surfaces challenges that do not appear in controlled benchmark settings. Documenting them is part of what distinguishes a rigorous proof of concept from a prototype that only works in the lab.
Data Consistency at Scale
Collection guidelines were provided to all collaborators, but consistent application across a large group proved difficult. Differences in interpretation of centring requirements, acceptable building types, and the handling of partially obscured structures introduced variation that required two cleaning rounds to address. Clear guidelines are necessary but not sufficient at scale. Automated validation tools applying standardised checks programmatically, rather than relying on individual judgment, would reduce the cleaning burden in any future expansion.
Point Cloud and Image Misalignment
Spatial registration between aerial images and point clouds was inconsistent in a subset of records. Where GPS coordinates did not precisely align the two data types, models received conflicting spatial signals, degrading performance. Automated pre-processing using feature matching or image-to-point-cloud registration would address this systematically and reduce the proportion of records discarded at cleaning.
Sparse and Contaminated Point Clouds
Point clouds from Digital Surface Models often lacked sufficient density after noise filtering, particularly for smaller roof sections and complex overhanging structures. Ground elements, vegetation, and adjacent structures also persisted across many records, necessitating manual post-processing that introduced delays and inconsistencies. More advanced outlier removal algorithms and multi-view data fusion would improve point cloud quality upstream of the segmentation model.
Transfer Learning Limitations
The rooftop dataset’s characteristics made it difficult to leverage pre-trained model weights from general-purpose computer vision tasks. Features learned on ImageNet did not transfer as effectively to aerial industrial imagery as benchmark performance would suggest. Domain adaptation techniques, or fine-tuning on a curated subset of the target data before full training, would better align pre-trained representations with this domain.
What the System Delivers
The pipeline takes aerial imagery and Digital Surface Model data as inputs and produces four structured outputs for each identified roof plane: tilt, azimuth, relative height, and perimeter. These are the inputs that PV simulation and panel placement software need to begin yield modelling. A designer who receives these outputs proceeds directly to simulation without measuring a single value by hand.
The system handles the full range of roof types in the training data: two-sided gabled, sawtooth, diagonal, and flat. Each presents different segmentation and attribute estimation challenges, and the pipeline was developed and tested across all four. Because it is built on trained models rather than hard-coded rules, it is retrainable for new geographies, imagery sources, and building types without redesigning the underlying architecture.
Results and Where This Work Stands
The point cloud segmentation model achieved approximately 80% validation accuracy, classifying rooftop points from surrounding elements. That means correctly identifying the roof surface in four out of five cases at the point level, a meaningful baseline for a system operating on real-world, unclean point cloud data across diverse industrial building types.
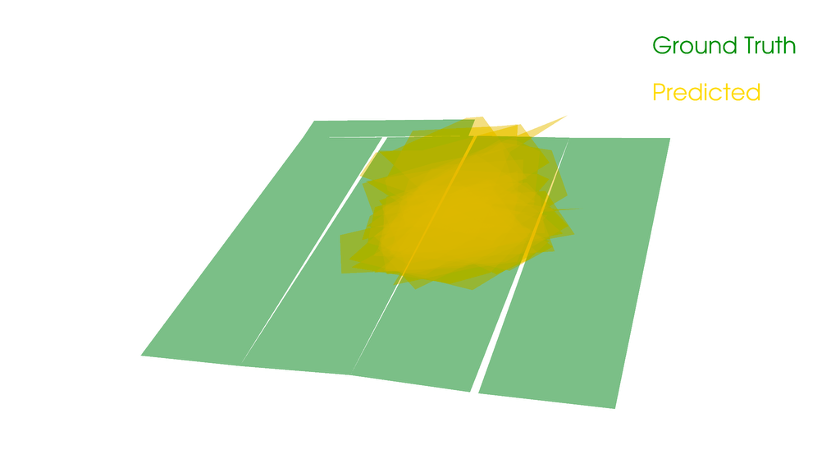
EfficientNetB0 showed consistent loss convergence across all four output attributes during training, with substantially better spatial coverage than ResNet50 on ground-truth roof planes. ResNet50’s predictions failed to maintain reliable spatial alignment between predicted and actual plane locations, as visible in the comparison below, confirming that EfficientNet’s architectural efficiency translated into better generalisation on this task.
Figure 7: ResNet50 plane attribute estimation results showing the spatial continuity challenge. Ground truth roof planes (green) versus model predictions (yellow): the prediction collapses to a central cluster rather than distributing across the actual plane geometry. This comparison directly motivated the selection of EfficientNetB0 as the production model.
These results deserve careful framing. This is a proof of concept validated on the dataset used to train and evaluate the models. The plane attribute estimation results show promising convergence in loss, but spatial continuity between predicted planes remains the key engineering challenge to resolve before production deployment. A formally held-out test set, kept entirely separate from validation data, would be required to report deployment-ready performance metrics.
The mesh evaluation produced a clear conclusion: Marching Cubes is the most practical method for real-world industrial rooftop data. Its tolerance for noisy, incomplete point clouds and absence of specialised hardware requirements make it the appropriate default. PLY-format outputs can be directly visualised in standard engineering tools, completing the pipeline from aerial image to structured 3D geometry.
Across all three phases, the team identified specific improvements for production readiness: automated point cloud pre-processing, image-to-point-cloud registration, refined loss functions better suited to geometric boundary tasks, and an expanded dataset to reduce dependence on augmentation. Each is a bounded engineering problem, not a fundamental rethink of the approach.
From Output to PV Design: Two Practical Scenarios
The pipeline produces structured geometric outputs ready for simulation software, with ~80% point cloud segmentation accuracy, validated on real industrial and commercial rooftops. That changes the economics of the pre-sales assessment process most visibly at the go/no-go decision point.
A solar EPC contractor receives an enquiry covering a warehouse portfolio. Manually, that means site visits, measurements, and a 3D model per building before any simulation can run. With aerial imagery and DSM data as input, the pipeline generates tilt, azimuth, height, and perimeter per roof plane, feeds those outputs directly into simulation software, and produces a ranked feasibility assessment without visiting a single site. Field visits are reserved for the buildings that justify the investment.
A commercial solar developer assessing dozens of industrial properties needs to identify geometrically suitable buildings before committing specialist engineering time. Without automation, that means running the same manual modelling exercise on every building before a single simulation can confirm viability.
The ~80% accuracy supports confident triage: strongest candidates are identifiable directly from the output, and edge cases are flagged for human review rather than consuming the same engineering time as clear winners. The assessment that previously required weeks of sequential effort becomes a structured batch process with defined accuracy bounds.
About the Project
Omdena led this project on automated 3D roof reconstruction for solar PV design, running four engineering streams simultaneously: aerial image segmentation with YOLOv11 and SAM2; point cloud classification with PointNet; plane attribute estimation comparing EfficientNetB0 and ResNet50; and 3D mesh reconstruction benchmarking three algorithms. The parallel structure compressed the delivery timeline and let each stream’s outputs inform the others.
Combining 2D image analysis, 3D geospatial processing, and deep learning within a single project is a multi-domain scope that typically requires an enterprise AI team. Omdena delivers that capability at around a third of what enterprise AI development typically costs, through a proprietary agentic AI platform and a structured delivery process.
If you are working on solar PV design automation, rooftop feasibility assessment, or looking to apply computer vision to geospatial and aerial data challenges,reach out to Omdena to discuss how this approach applies to your context.
FAQ
What problem does this solve for solar companies?
Manually estimating tilt, azimuth, height, and perimeter for each roof plane takes a full working day on complex industrial buildings before simulation can begin. This pipeline automates that step from aerial imagery and Digital Surface Model data, so designers move straight to simulation.
How accurate is the system, and what does that mean in practice?
PointNet achieved approximately 80% validation accuracy on real industrial rooftops, correctly identifying the roof surface in four out of five cases. For portfolio triage, that is sufficient to rank buildings confidently and flag edge cases for human review.
How does it handle complex multi-plane roof structures?
The attribute estimation model predicts tilt, azimuth, height, and perimeter for each roof plane individually. Plane data is encoded as a fixed-length sequence with padding for variable complexity, so the model handles sawtooth profiles without per-building configuration.
Why was Marching Cubes chosen over Poisson Surface Reconstruction?
Poisson requires at least 4,096 clean, fully isolated points and an A100 GPU, conditions that real-world industrial data rarely meets. Marching Cubes handles noisy, incomplete data using Gaussian smoothing, runs without specialised hardware, and outputs in the standard PLY format.
What are the next steps before production deployment?
The core pipeline architecture is in place. The remaining steps are bounded engineering tasks: improving spatial continuity in plane attribute output, automated image-to-point-cloud registration, a formally held-out test set, and an expanded training dataset.
Share this article
Share on LinkedIn, send by email, or copy the direct link.