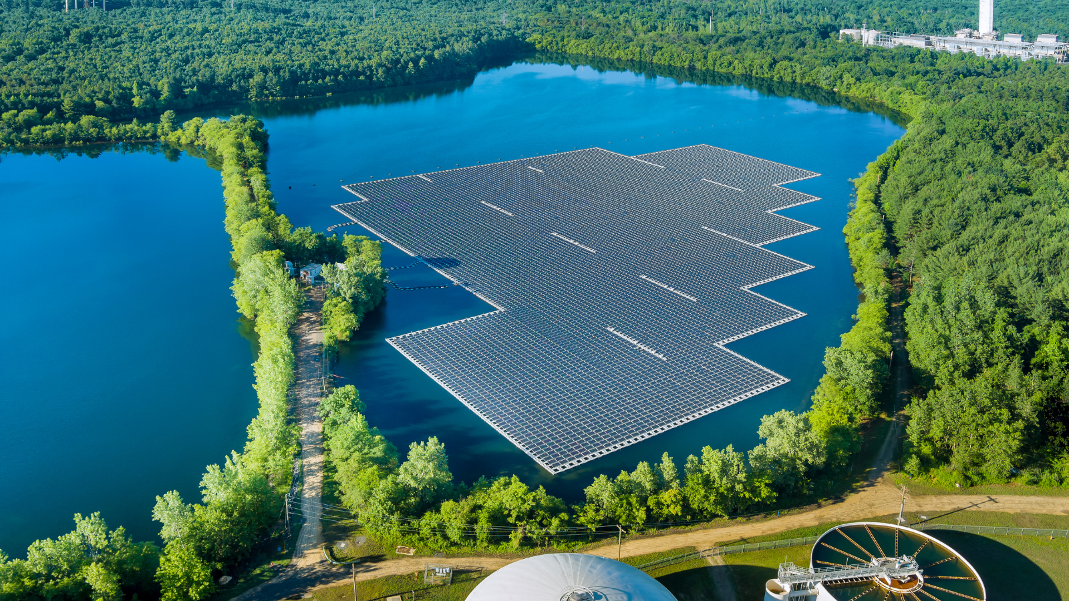
Floating solar projects start with the same problem: before committing survey budgets, a developer needs to know whether a reservoir is worth pursuing. That means depth data, water quality history, and surface conditions, three separate checks, each one traditionally requiring a site visit. This project set out to answer all three using satellite imagery and AI-based analysis.
Executive Summary
Floating solar is growing fast, but early-stage feasibility is slow and expensive. Before committing survey budgets, developers need to know whether a reservoir has the right depth profile, stable water quality, and workable surface conditions. Getting those answers traditionally means site visits, manual depth measurement, and separate environmental checks for every candidate site in every geography.
Omdena built an AI pipeline that screens floating solar sites using freely available Sentinel-2 satellite imagery. The system removes cloud cover from imagery, detects algal bloom risk across the water surface, and predicts water depth at metre-level resolution, producing structured feasibility data without a physical survey at the screening stage.
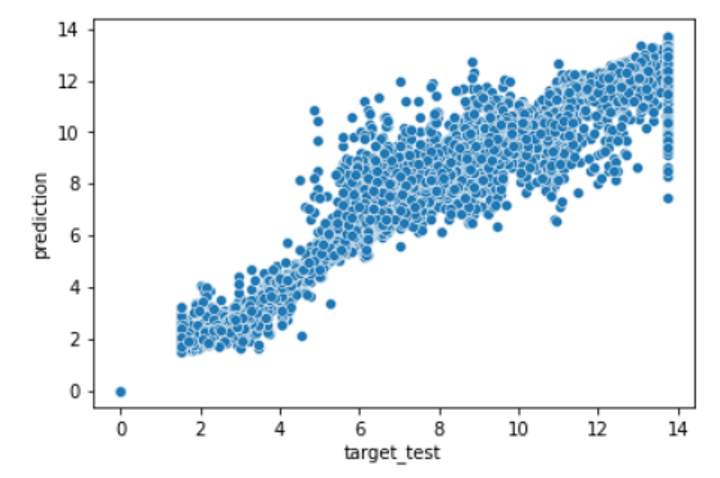
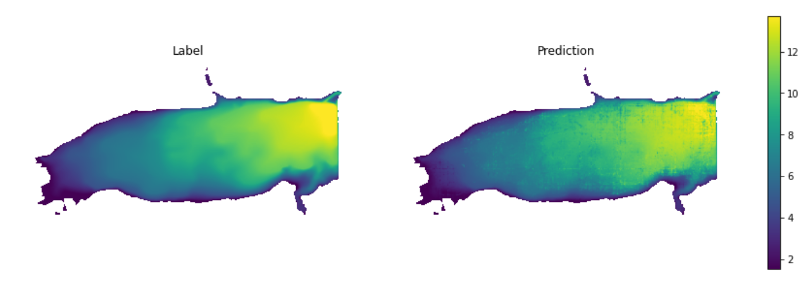
On Swanson Reservoir, the pipeline predicted water depth within 25 centimetres of measured values. The Random Forest model also achieved an ROC AUC of 0.95 on depth suitability classification. Data that would previously require field teams can now be generated on a desktop, reducing early-stage assessment time and costs before a single survey is commissioned.
| KEY FINDINGS | |
| MAE ~0.25m | depth prediction accuracy on Swanson Reservoir using Random Forest across all 13 Sentinel-2 spectral bands |
| ROC AUC 0.95 | depth suitability classification accuracy of the Random Forest model, correctly classifying water zones by depth suitability on Swanson Reservoir |
| No on-site survey required
during early-stage screening |
screening-stage feasibility assessment generated entirely from freely available Sentinel-2 satellite imagery at 10-metre resolution |
| S2 cloudless library | automated cloud masking, removing affected pixels before any spectral analysis, enabling reliable assessment in high cloud-cover regions |
| MODIS MYDOCGA V6 | algal bloom detection using ocean reflectance bands 15, 14, and 13, sensitive to chlorophyll concentration across the reservoir surface |
| Random Forest selected | outperformed all alternative models tested on depth prediction; uses all 13 Sentinel-2 bands as input for maximum spectral information |
Why Floating Solar Sites Are Hard to Screen
The business case for floating solar is well established: reduced land use, lower evaporation, and higher panel efficiency from water cooling. The bottleneck is pre-project screening. Developers evaluating a reservoir shortlist need answers to three questions before committing capital. Is the water deep enough to anchor floating structures safely? Is water quality stable enough to avoid long-term biofouling and maintenance risk? What does the surface look like across seasons and weather conditions?
Through conventional methods, each answer requires a separate process: on-site depth surveys, water sampling, and repeat site visits across seasons. For international portfolios or large candidate lists, that approach does not scale. A developer assessing twelve reservoirs across three countries cannot afford field visits to all of them before knowing which are worth pursuing.
The cost and time consumed screening sites that never make it past feasibility is a real drag on development pipelines. The opportunity is to compress that screening step by answering the baseline questions faster, earlier, and without sending teams to the site.
The Data: Why Satellite Imagery Works
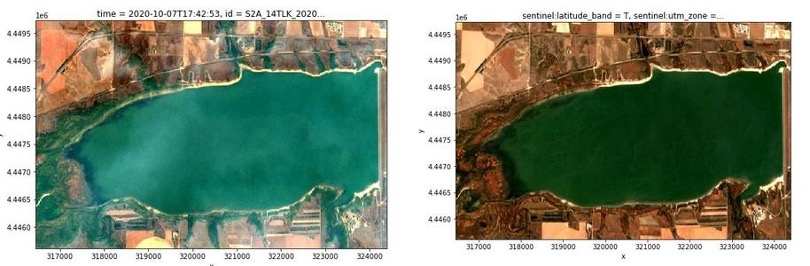
Sentinel-2 satellites capture multispectral imagery at 10-metre resolution on a regular revisit cycle, covering reservoirs globally at no cost. Each image contains 13 spectral bands that carry information about water surface conditions invisible to the naked eye. Depth, turbidity, biological activity, and surface quality all leave detectable signatures in the spectral data. But raw imagery is not analysis-ready: cloud cover and atmospheric interference mean preparing the data is as important as the modelling itself.
The pipeline draws on two satellite sources, each chosen for what it does best. Sentinel-2 provides the spectral resolution needed for depth modelling, with 13 bands updated on a five-day revisit cycle. MODIS is optimised specifically for water-body surface analysis, with its MYDOCGA V6 product designed to detect biological activity in water. Using each source for its intended purpose produces more reliable results than a single-source approach.
Preparing the Data: Cloud Removal and Water Quality
The first step is removing cloud-covered pixels from each Sentinel-2 image. Using the S2 cloudless library, the pipeline detects and masks cloud-affected areas, leaving only clean surface data for analysis. For reservoirs in tropical or high-altitude regions with frequent cloud cover, this step determines whether useful imagery exists at all for a given time window. Without it, large portions of a candidate site could be invisible to the model during key assessment periods.
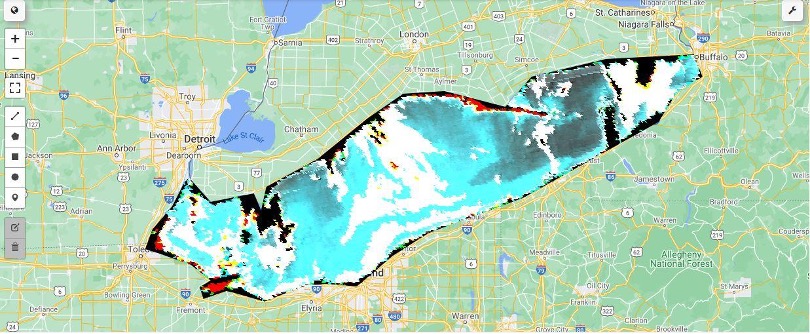
With clean imagery available, the pipeline assesses water quality using MODIS MYDOCGA V6 satellite data, specifically bands 15, 14, and 13, which are sensitive to chlorophyll concentration. The model classifies each surface zone as bloom-present or clean, producing a spatial map of algal bloom risk across the reservoir.
For a developer, that map answers a concrete question: does this reservoir have chronic bloom conditions that would affect panel performance and ongoing maintenance costs? Sites with persistent bloom risk can be flagged or deprioritised before any team visits the location, saving both travel budget and decision-making time.
Predicting Water Depth
Water depth is the critical structural variable for floating solar, determining whether anchoring systems are viable and what infrastructure is required. The team tested multiple model types on this prediction task. Random Forest, using all 13 Sentinel-2 spectral bands as inputs, consistently outperformed alternatives and was selected for the final pipeline.
Before modelling, the team ran correlation analysis across spectral bands, applied PCA to identify the most depth-relevant band combinations, and removed depth readings beyond 25 metres, which fall outside the practical range for floating solar infrastructure. That preparation step is what makes the model reliable on real-world reservoirs rather than clean test data. It also keeps the model focused on the depth range that actually matters for infrastructure decisions.
Swanson Reservoir was used as the primary test case, a real working reservoir with measured bathymetry data available for validation. The model’s outputs were compared directly against those measurements to produce the accuracy figures reported in the Results section.
What the Pipeline Delivers
The three pipeline components run in sequence on each target reservoir: cloud removal, water quality classification, and depth prediction. Together, they produce the core inputs a developer needs for an early-stage feasibility decision: a clean view of the water surface, a bloom risk map, and a depth profile, all from satellite data without a site visit.
| INPUT: Sentinel-2 Satellite Imagery + MODIS Data (free, global coverage) | ||
| ↓ | ↓ | ↓ |
| STAGE 1 | STAGE 2 | STAGE 3 |
| Cloud Removal
S2 cloudless library: masks cloud-affected pixels across all imagery |
Algal Bloom Detection
MODIS MYDOCGA V6 bands 15/14/13: classifies water quality zones |
Depth Prediction
Random Forest across all 13 Sentinel-2 bands: MAE ~0.25m |
| ↓ | ||
| OUTPUT: Depth Map + Bloom Risk Map → Feasibility Assessment Data | ||
The pipeline is built as modular Python components covering data access, preprocessing, and modelling, meaning it can be applied to new reservoirs without rebuilding from scratch. It draws on the Bathybase Dataset and Global Reservoir Dataset for bathymetric reference values, providing a validated baseline for depth calibration on new sites.
One current constraint is worth stating directly: the depth model is calibrated per lake rather than universally. A developer assessing a new reservoir runs the model fresh for that site. For portfolio screening, that means a calibration step per site. That is not a blocker for using the tool, but a factor in planning how it fits into the workflow.
The practical shift is when fieldwork happens. Site visits, if they happen at all, come after satellite-based screening has already filtered the candidate list, answered the baseline questions, and identified which sites merit closer investigation. The cost of assessing a site that does not proceed is reduced to the cost of running the pipeline, not the cost of sending a survey team.
What the Model Achieved
On Swanson Reservoir, the Random Forest model predicted water depth with a mean absolute error of approximately 25 centimetres across the full depth range relevant to floating solar infrastructure. That level of accuracy is sufficient to make go/no-go decisions on anchoring feasibility without commissioning a physical bathymetric survey.
The same Random Forest model achieved an ROC AUC of 0.95 for depth-suitability classification, correctly classifying water zones by depth suitability in 95% of cases. Both metrics were produced from satellite data alone, with no field measurement required at the screening stage.
Random Forest outperformed all alternative models tested on this task. Several candidate approaches failed on the dataset; others showed overfitting that did not hold under real-world conditions. The final model’s robustness came in part from the data preparation steps, including removing readings beyond 25 metres and applying PCA to isolate the most depth-relevant spectral bands before training.
How This Works in Practice
A developer with twelve candidate reservoirs across three countries runs satellite-based assessment across the full list before any survey budgets are committed. Depth profiles, water quality flags, and seasonal surface conditions are compared across all sites. Those that fail basic viability criteria are eliminated in the first week. Survey teams go only to sites that have already passed remote screening, meaning every field visit starts with validated data rather than open questions.
An existing floating solar operator uses the cloud-removal and algal-bloom layers to track reservoir conditions year-round. When bloom activity spikes in late summer, a predictable seasonal pattern on many reservoirs, the team schedules panel cleaning before performance drops rather than after. Maintenance windows are planned, not reactive. The same satellite data that informed the initial site decision continues to generate value throughout the operational lifecycle.
The Numbers
| Metric | Result |
| Depth prediction error | MAE ~0.25m |
| Depth suitability classification | ROC AUC 0.95 |
| Satellite data source | Sentinel-2 (free, global coverage) |
| On-site survey required | Not at the screening stage |
About the Project
Omdena led this project on AI-powered floating solar site assessment for Glint Solar, running a satellite data pipeline that covered cloud removal, algal bloom detection, and water depth prediction from Sentinel-2 imagery. The modular pipeline was delivered with documentation and datasets, ready for integration into floating solar feasibility workflows.
This project is one of over 500 Omdena has delivered across AI, machine learning, and computer vision, spanning solar energy, climate, agriculture, healthcare, and infrastructure. Each project follows the same structure: cross-functional engineering teams, parallel workstreams, and delivery on a fixed timeline.
AI-powered feasibility assessment is now a practical capability for floating solar development teams. Omdena delivers that capability at around a third of what enterprise AI development typically costs, through a proprietary agentic AI platform and a structured delivery process.
To discuss how this could apply to your floating solar pipeline, reach out to Omdena.