If you’ve worked with production AI systems long enough, you’ve probably heard some variation of these statements, only to discover days or even weeks later that the predictions being served were quietly degrading the entire time.
Unlike traditional software systems, machine learning systems rarely fail dramatically. Nothing broke. No exception, no crashed job, no spike in 500 errors. The pipeline did exactly what it was asked to do: read data, transform it, and feed it to the model. The problem is that the data it read was no longer the data the model expected, and nothing was watching for that.
The data changes.
The world changes.
The model keeps making predictions.
Users slowly begin losing trust.
This isn’t a rare hypothetical. It’s the default failure mode of any data or ML system that has monitoring but no observability. And the difference between those two terms, often used as if they were interchangeable, is exactly what determines whether your team finds out about a problem before your user does, or after.
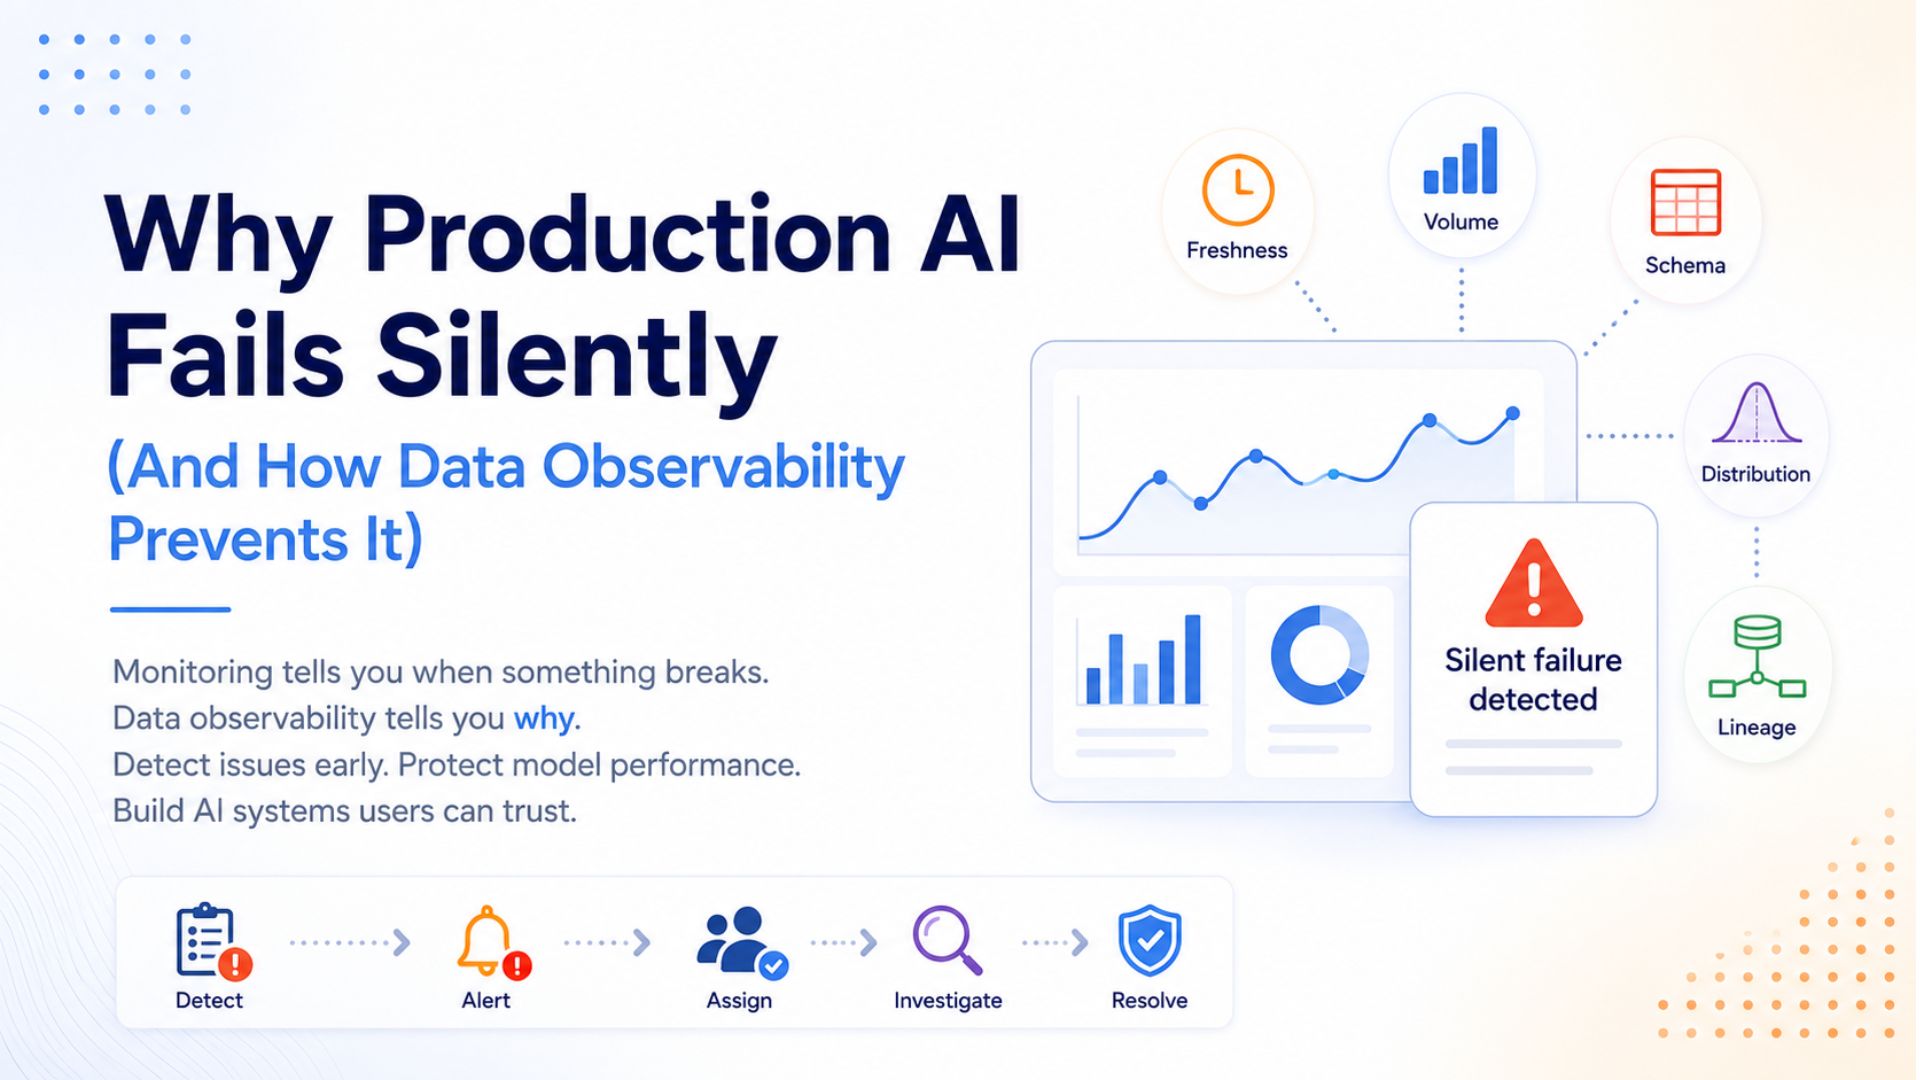
This is one of the biggest challenges organizations face when moving AI applications into production: the most dangerous failures are often the quietest ones.
Production Readiness Doesn’t End at Deployment
Many teams think of production readiness as a deployment milestone.
Once the model is packaged, tested, deployed, and connected to monitoring dashboards, the project is considered “done.”
In reality, deployment is only the beginning.
Production-ready AI systems must continuously answer questions like:
Is today’s data actually today’s data?
Are we receiving the expected amount of data?
Did an upstream team silently change a schema?
Have feature distributions drifted from what the model was trained on?
If something breaks, who owns the problem?
Traditional infrastructure monitoring cannot answer these questions.
CPU utilization, memory consumption, response times, and application logs tell us whether the software is healthy, not whether the data feeding our models is still trustworthy.
This distinction becomes increasingly important as organizations rely on machine learning to support customer experiences, business decisions, fraud detection, forecasting, recommendation systems, and generative AI applications.
Monitoring Tells You When. Observability Tells You Why.
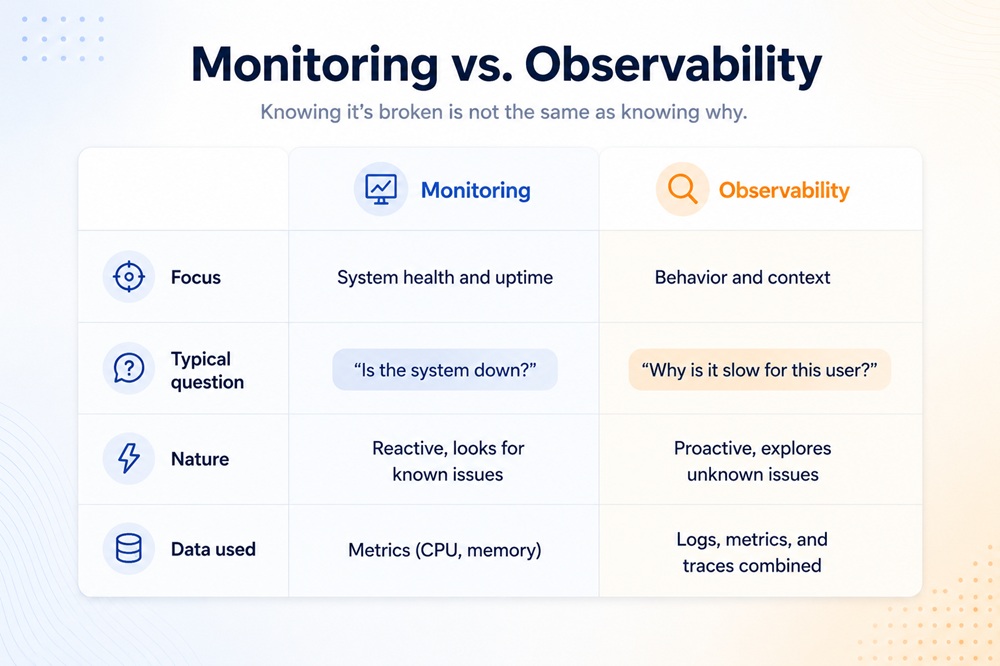
Monitoring vs Observability
Monitoring and observability are often used interchangeably, but they solve different problems.
Monitoring answers predefined questions.
Is the API responding?
Is latency above the threshold?
Did the scheduled job finish?
These are important signals, but only for problems we already anticipated.
Observability goes further.
It allows engineers to investigate unknown problems by combining multiple signals and asking new questions after the system is already running.
A monitoring dashboard might tell you:
API latency increased from 200 ms to 2 seconds.
An observable system can tell you:
Latency increased because the payment service is timing out after an upstream schema change delayed feature generation.
The difference is subtle but critical.
Monitoring detects symptoms.
Observability helps explain causes.
This framework comes from the software world, and it works well there. The problem shows up when we apply it as-is to a system that is also made of data, and of a model trained on that data.
AI Systems Introduce a Fourth Layer
Software observability has traditionally been built around three pillars:
Metrics
Logs
Traces
Machine learning systems inherit all three.
But none of the three classic pillars look at the data flowing through the system. This is the fourth layer.
This fourth layer includes questions such as:
Is the data fresh?
Did the schema change?
Has the distribution shifted?
Are we missing records?
Where did this feature originate?
These aren’t infrastructure problems. They’re data problems. And data problems rarely generate exceptions.
A pipeline can be perfectly healthy, no errors, no timeouts, no crashes, and still be serving garbage predictions, because nobody is watching whether that data is still fresh, complete, the right shape, the expected distribution, or traceable back to its source.
That’s the layer data observability adds: freshness, volume, schema, distribution, and lineage. Software observability watches the system. Data observability watches what flows through it.
The Most Dangerous Failures Are Silent
Software failures are loud almost by nature: the job throws an exception, the dashboard turns red, on-call gets paged within minutes. They’re easy to spot and, generally, quick to resolve.
Data failures are a different species. Everything runs without errors. Nothing crashes. And the output is wrong. Accuracy degrades week after week, with no threshold ever tripping, until a human, a domain expert, an analyst reviewing outputs, or a user directly notices something doesn’t add up. By then, trust has already taken the hit.
The most common silent failure modes share a recognizable pattern: they all “run fine,” and they all corrupt the data.
Schema change: a column gets renamed or dropped, nulls flow downstream, and the pipeline still exits successfully.
Late or partial batch: yesterday’s rows get served as if they were today’s.
Distribution shift: inputs move, the model keeps scoring with the old shape.
Join fan-out: a bad key duplicates rows, inflating counts and features.
Silent label logic change: the definition of “correct” gets redefined without anyone documenting it.
Exit code 0, and the data is still wrong. That’s the actual problem data observability exists to solve.
The Five Pillars That Make the Invisible Visible
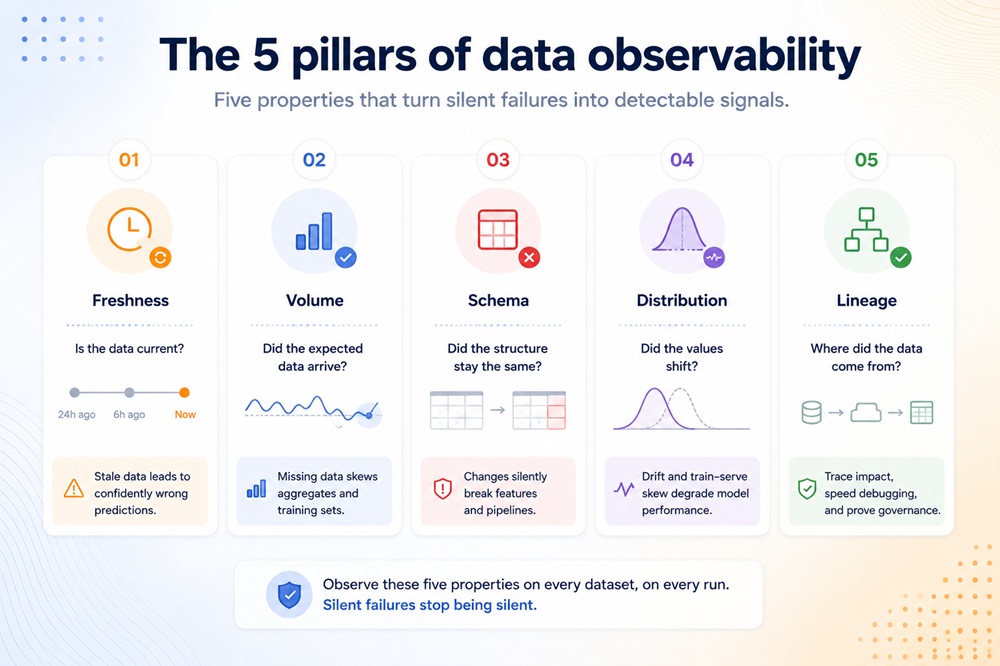
The Five Pillars of Data Observability
Five properties turn a silent failure into something that can be detected, prioritized, and assigned to an owner:
1. Freshness
Question
Is the data current?
Why it matters
Serving yesterday’s features often produces confidently incorrect predictions.
Typical signals
Last update timestamp
Watermarks
Source freshness SLAs
2. Volume
Question
Did the expected amount of data arrive?
Why it matters
Missing records distort aggregates, training datasets, and downstream predictions.
Typical signals
Row counts
Historical baselines
Z-score anomalies
3. Schema
Question
Has the structure changed?
Why it matters
Renamed columns, changed data types, or missing fields frequently break feature engineering without generating runtime errors.
Typical signals
Column validation
Data type checks
Null-rate monitoring
4. Distribution
Question
Do today’s values resemble yesterday’s?
Why it matters
Models are built on assumptions about data distributions.
When those assumptions no longer hold, accuracy declines—even if every pipeline succeeds.
Metrics such as the Population Stability Index (PSI) provide an effective way to quantify feature drift.
5. Lineage
Question
Where did this data come from?
Why it matters
Lineage transforms debugging from hours into minutes by revealing every downstream dependency affected by a change.
Without lineage, incident response often becomes guesswork.
These five pillars aren’t a list of good intentions; in practice, they’re the five questions any production pipeline should be able to answer before anyone trusts its output.
What to Observe, in Order of Maturity
Maturity here builds in three levels. Level one is the baseline every pipeline should emit before anyone asks about the model: execution, volume (z-score vs. historical mean), freshness watermark, schema drift, null rates, referential integrity, key uniqueness.
Level two is the ML layer: distribution shift and train-serve skew, both measured with PSI (under 0.1 stable, 0.1–0.25 investigate, above 0.25 act), plus label/ground-truth drift, model input/output monitoring, and end-to-end lineage.
Level three is the alert itself, which should answer one question: who does what, right now? That means clear thresholds, anomaly detection, severity tiers, ownership routing, SLO-tied alerts, and a dead-man’s switch, silence is a failure too.
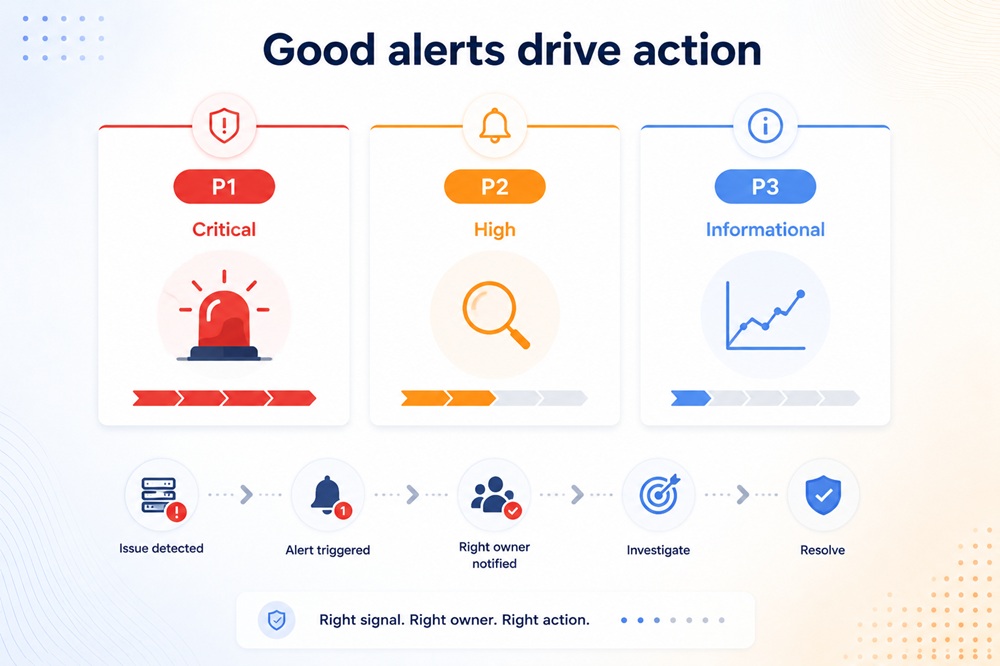
Good alerts drive action
In practice, that translates into three severity levels:
P1 – page now. Wrong data is already live in production.
P2 – investigate today. A metric is trending the wrong way.
P3 – track. Informational, no immediate action required.
Building an Observability Stack
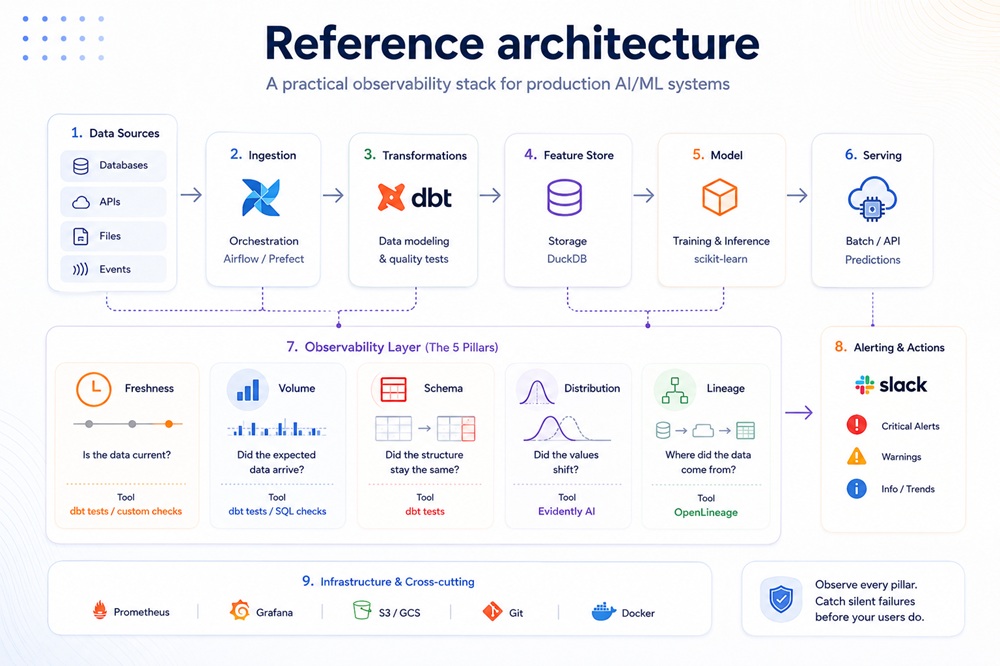
Reference Architecture
A common misconception is thinking data observability means adopting an enterprise platform from day one. In reality, each layer- data quality, lineage, feature monitoring, model performance- is a distinct question, and mature open-source tooling already covers almost all of it:
Layer
What it answers
Reference tools
Data quality
Is each value valid, complete, in range?
Great Expectations, dbt tests + dbt-expectations, Soda Core
Lineage
Where did it come from, what depends on it?
OpenLineage + Marquez, dbt docs (lineage graph)
Feature monitoring
Have the distributions moved?
Evidently AI, WhyLogs/WhyLabs, TFDV
Model performance
Is the model still behaving as trained?
Evidently AI, Monte Carlo (managed)
Infrastructure & tracing
Duration, retries, memory, spans?
Prometheus + Grafana, OpenTelemetry
Orchestration
Did the pipeline run, with what materialization events?
Coverage doesn’t come from buying one platform that does it all. It comes from connecting layers. A gap in any one of them is a blind spot, no matter how good the tooling covering the rest is.
From Theory to a Real Pipeline: Four Failures, Four Ways to Not Find Out from Your User
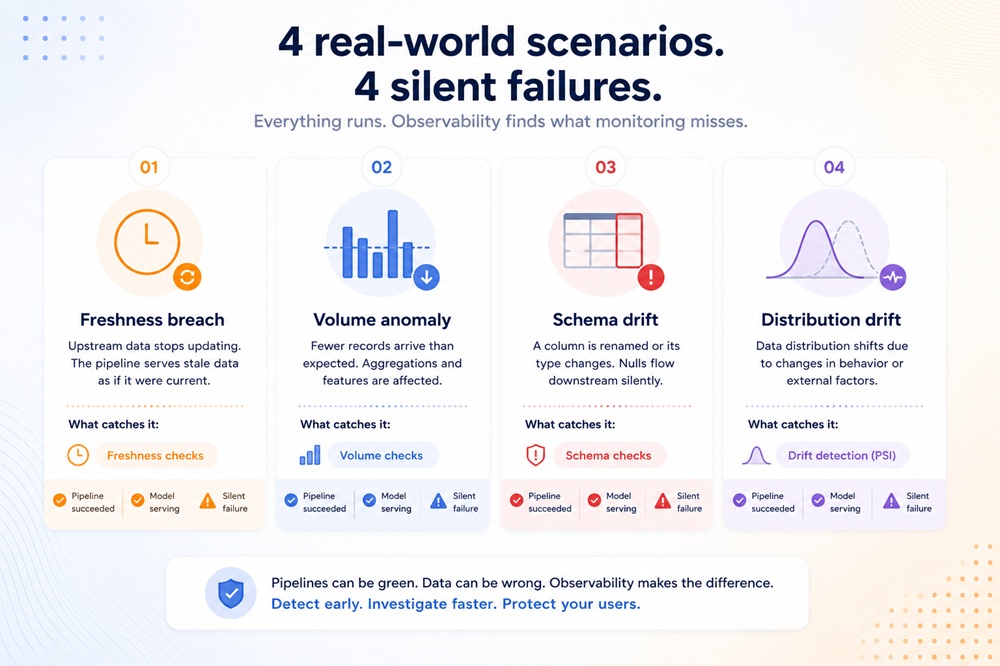
Four Real World Scenarios
To prove this framework isn’t just theory, we built an end-to-end pipeline: a synthetic event generator, a feature store built with dbt, and a scikit-learn model doing batch scoring for customer churn. On top of that, the full observability stack: dbt tests, a drift check with Evidently, and alerts routed to Slack.
The exercise was simple: inject, one at a time, the 4 most common silent failures, and see whether the stack caught them and routed them to the right person before they ever reached a real user.
Scenario 1: Freshness Breach
The upstream ingestion job silently stops.
The latest dataset is now 48 hours old.
The pipeline succeeds.
The model serves predictions.
An observability check detects that the freshness SLA has been violated and immediately routes a high-priority alert to the data engineering team.
Scenario 2: Volume Anomaly
Only half the expected customer records arrive.
No pipeline fails.
The model still runs.
Row-count validation immediately detects the anomaly relative to historical baselines, allowing engineers to investigate before downstream analytics are affected.
Scenario 3: Schema Drift
An upstream source renames a feature column.
Every transformation completes successfully.
The feature becomes entirely NULL.
The observability layer catches the issue through schema validation before corrupted features reach production.
Scenario 4: Feature Distribution Drift
This was the most interesting scenario.
A marketing campaign brings in a completely different customer population.
Every pipeline succeeds.
Every data quality test passes.
Every row is valid.
Nothing appears broken.
Yet feature distributions have shifted dramatically.
Using statistical drift detection with PSI, the observability layer identifies that the incoming data no longer resembles the reference distribution used during model training.
Instead of routing the alert to a data engineer, the incident is assigned to the ML engineer and model owner. The data isn’t incorrect. The model assumptions are. That distinction is essential.
Synthesized into a table, the pattern holds: the tool that catches the failure is also the one that names the owner who fixes it.
The full code, data generator, model, checks, failure injection, and alerting is published and reproducible on a laptop; no cloud or paid services required:
The real shift that separates a production-ready system from one that isn’t isn’t more dashboards. It’s the kind of question the team can answer without depending on a user complaining first.
Common anti-pattern
Production-ready pattern
Discovering issues from user complaints
Proactive alerting on leading signals
Manual SQL debugging to find the cause
Root cause via lineage graph
No baseline for what’s “normal”
Training-time profiles stored as reference
Monolithic alerts, everything pages
Tiered alerting with owner routing
Observability bolted on after an incident
Observability-as-code, from day one
Quality checks only at ingestion
Quality gates at every pipeline stage
Observability Is Ultimately About Trust
AI adoption isn’t limited by model performance. It’s limited by confidence.
Users don’t stop trusting AI because a container crashes. They stop trusting AI because it confidently returns incorrect answers.
That erosion rarely happens overnight. It happens one silent failure at a time. Freshness slowly drifts. Schemas evolve. Feature distributions change. Labels become outdated. Without observability, these problems remain invisible until someone notices the business impact.
By then, the damage has already been done. Production-ready AI isn’t defined by whether a model can be deployed. It’s defined by how quickly a team can detect, understand, and recover from the inevitable changes that occur after deployment.
Because in production, the question isn’t whether something will break.
It’s whether you’ll know before your users do.
Further Reading & Resources
If you’d like to explore these concepts in more depth, here are the resources referenced throughout this article.
Data observability is the practice of continuously monitoring the health, quality, and reliability of the data flowing through AI and machine learning systems. Unlike traditional infrastructure monitoring, it focuses on detecting issues such as stale data, schema changes, missing records, feature drift, and broken data pipelines before they impact model performance. Data observability enables teams to identify, investigate, and resolve data issues before they affect users or business outcomes.
What is the difference between monitoring and observability in AI systems?
Monitoring answers predefined questions, such as whether an API is available or a pipeline completed successfully. Observability goes further by helping engineers investigate why unexpected issues occur. In AI systems, observability combines infrastructure signals with data quality, feature distributions, lineage, and model behavior to uncover silent failures that traditional monitoring cannot detect.
Why do AI systems fail silently in production?
Most production AI failures are caused by changes in data rather than software errors. Data may become outdated, incomplete, or structurally different from what the model was trained on, while pipelines continue to run without generating exceptions. Since the infrastructure appears healthy, these issues often go unnoticed until model accuracy declines or users report incorrect predictions.
What are the key pillars of data observability?
The five core pillars of data observability are: Freshness: Is the data up to date? Volume: Has the expected amount of data arrived? Schema: Has the structure of the data changed? Distribution: Do today's data patterns match historical behavior? Lineage: Where did the data originate, and what downstream systems depend on it? Together, these pillars help teams detect and troubleshoot data issues before they affect AI applications.
Which tools are commonly used for data observability?
Organizations often combine multiple open-source and commercial tools to build a complete observability stack. Popular options include Great Expectations, dbt, and Soda Core for data quality; OpenLineage and Marquez for lineage; Evidently AI and WhyLogs for feature and model monitoring; Prometheus, Grafana, and OpenTelemetry for infrastructure observability; and orchestration platforms like Airflow, Prefect, and Dagster. The right combination depends on the organization's architecture and production requirements.
Share this article
Share on LinkedIn, send by email, or copy the direct link.