In LLM systems, success and correctness are two different things, and only one of them shows up in your logs.
LLM applications rarely fail in the way traditional software fails.
A server can be healthy. An API can return 200 OK. A retrieval pipeline can complete successfully. The model can produce a fluent, confident answer.
And the answer can still be wrong.
That is what makes production LLM systems difficult to operate. The failure is not always a crash or an exception. Sometimes it is a subtle increase in cost, a degraded retrieval result, stale context, a hallucinated answer, an unavailable model provider, or a tool call that quietly adds latency to a multi-step agent workflow.
The challenge is therefore bigger than monitoring whether the application is up.
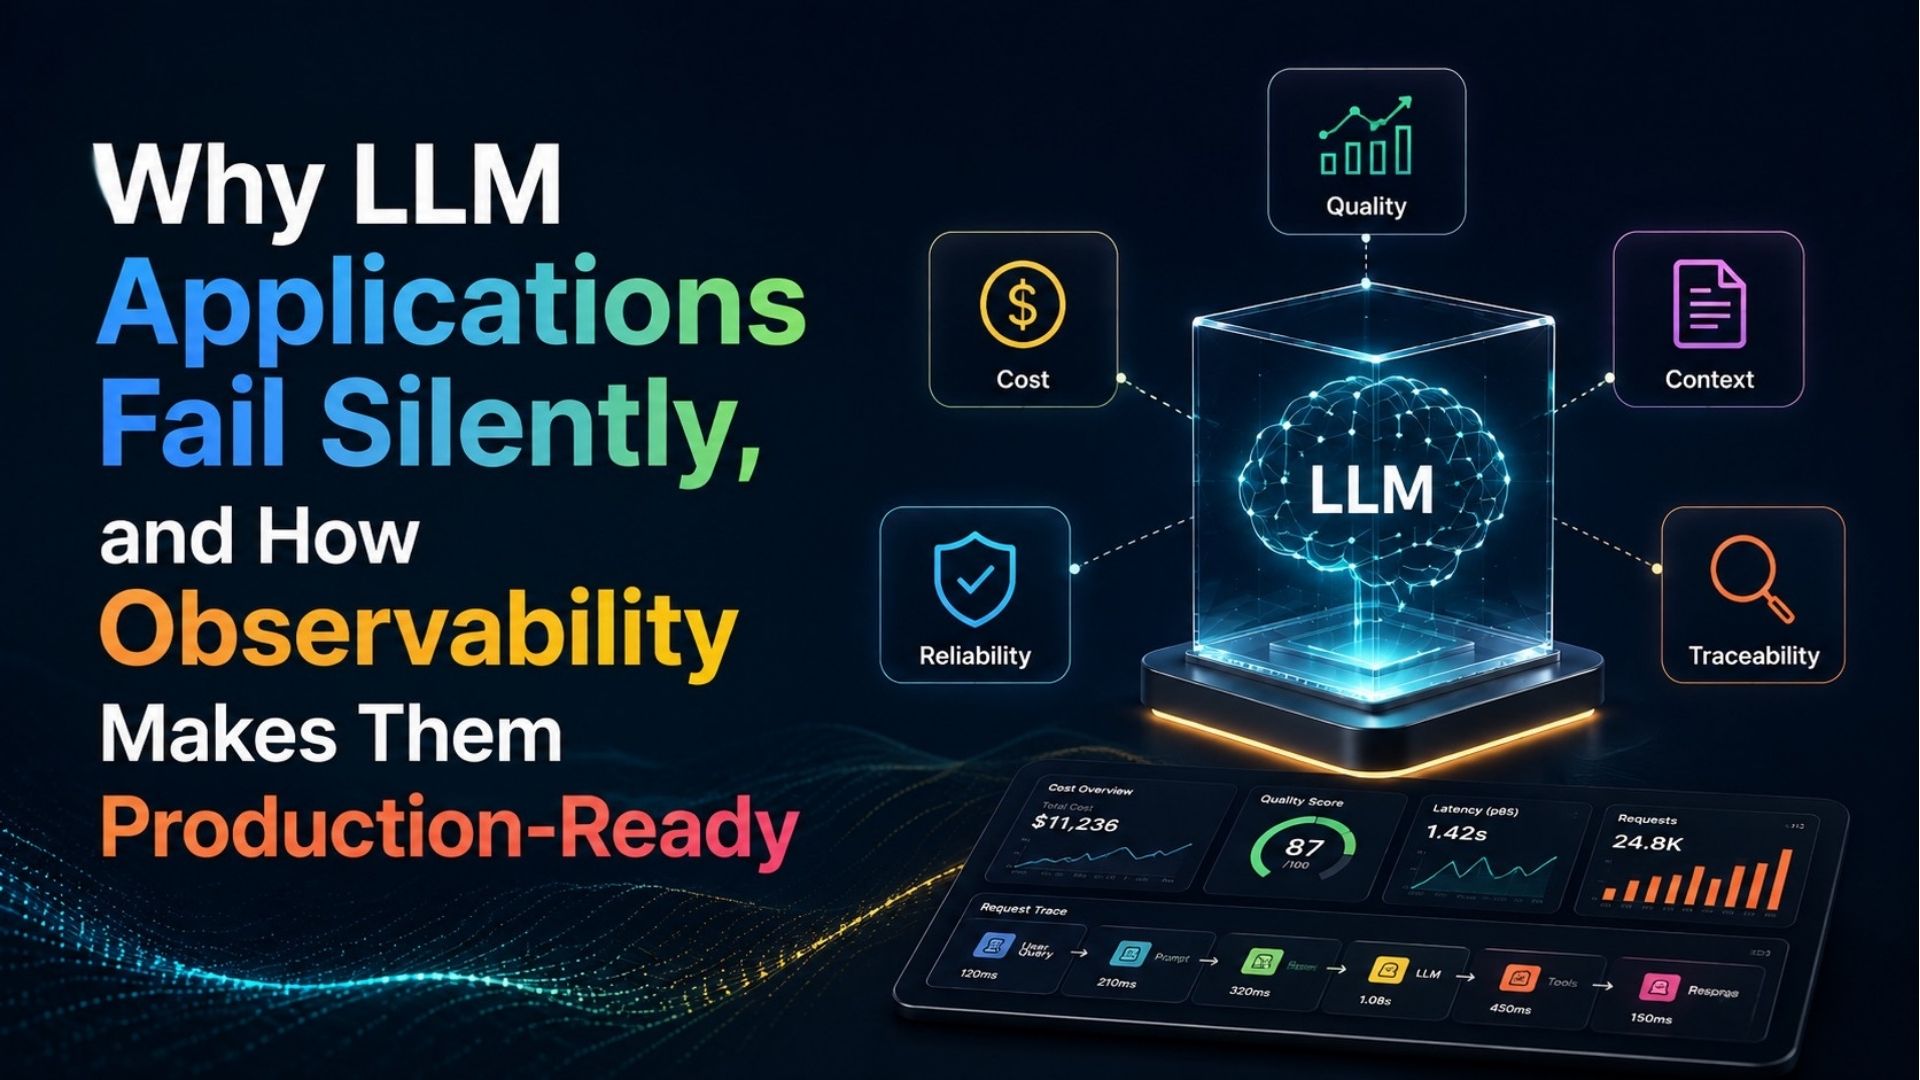
A production-ready LLM application needs to make the important signals visible: cost, quality, context, reliability, and traceability.
This article explores how those signals fit together, why they should be observed per request, and how teams can use them to diagnose problems without relying on users to discover them first.
The goal of LLM observability is not to collect more telemetry. It is to make the behavior of the generation pipeline explainable enough to act on.
What Makes LLM Observability Different?
A traditional application often has relatively clear failure signals.
A request fails. A database times out. A service returns an error. Latency crosses a threshold.
LLM applications introduce a different class of failure: the request succeeds technically while the result fails semantically.
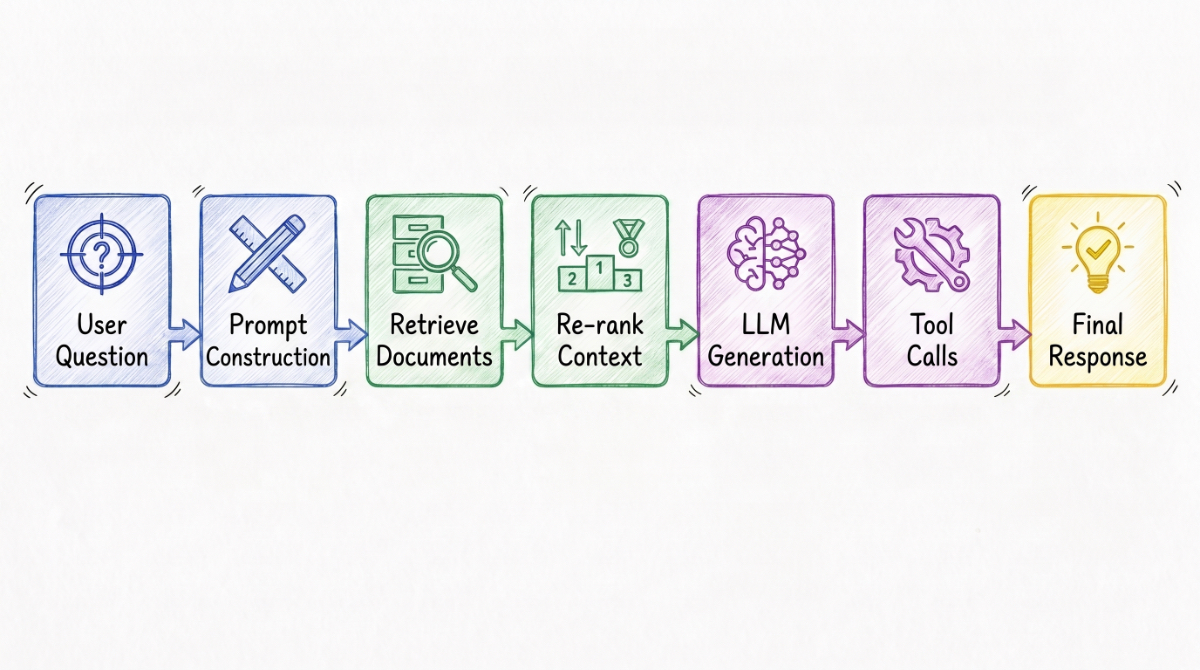
Consider a typical LLM pipeline:
Typical LLM Pipeline
Every stage can generate signals, and every stage can introduce a problem.
The user question may be ambiguous. Prompt construction may add unnecessary tokens. Retrieval may return irrelevant or outdated documents. The model may generate unsupported information. A tool call may fail or introduce unexpected latency. The final response may look perfectly reasonable even when the underlying context was wrong.
This is why LLM observability has to look beyond infrastructure health.
Traditional Observability Doesn’t Transfer Cleanly
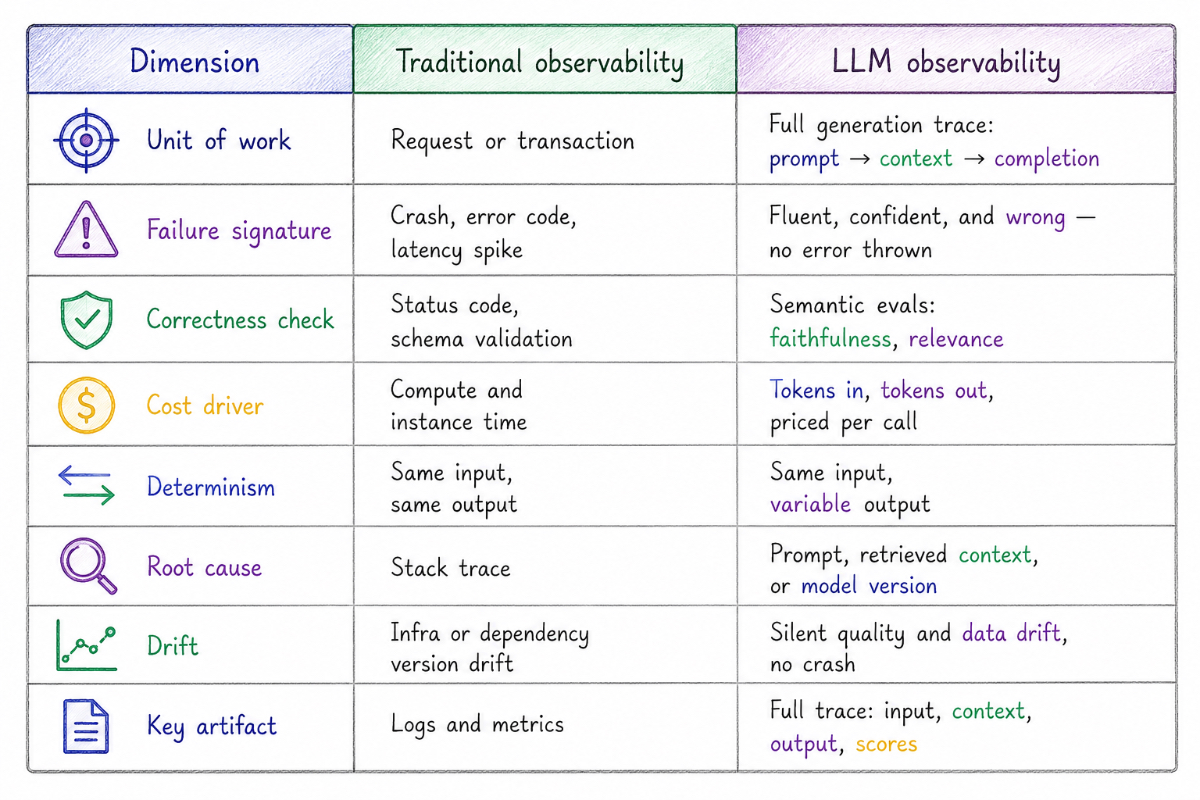
Most engineering teams already have observability for their services: metrics, logs, traces, alerts on error rates and latency. That foundation matters, and every one of those concerns still applies. But nearly every dimension has a direct analog in LLM systems that behaves differently enough to break the assumptions underneath your existing tooling.
Traditional Observability vs LLM Observability
The row that does the most damage is the second one. Traditional systems are close to binary: a request either succeeds or it doesn’t, and failure announces itself. An LLM request can succeed completely, every span green, every dependency healthy,gemi and still produce an output that is factually invented, subtly off-topic, or grounded in a document that was correct two weeks ago.
If nothing in your system is watching for that, you will not find out. Your users will.
The Five Signals Worth Instrumenting
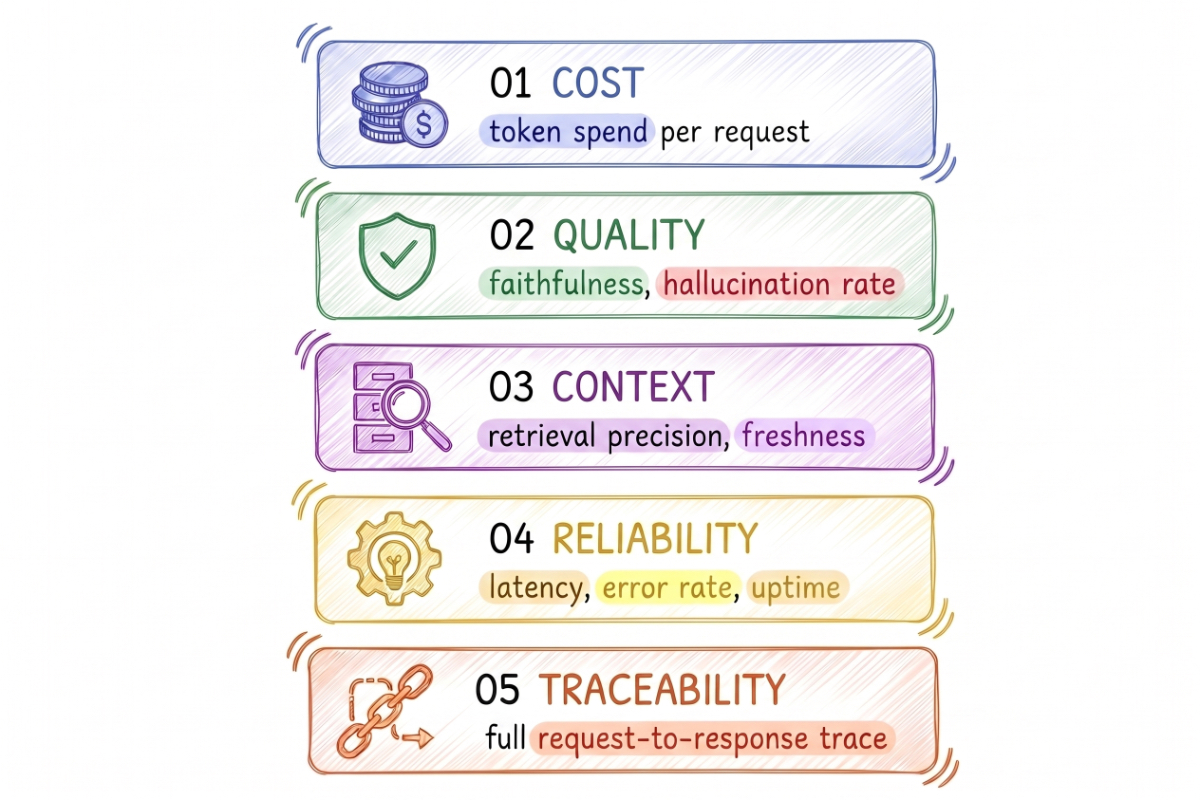
Before choosing tools, it helps to be explicit about what you’re trying to see. Five signals cover most of what actually goes wrong in production LLM applications.
The Five Signals Worth Instrumenting
The point of naming them is not taxonomy for its own sake. It’s that each signal catches a class of failure the others miss, and, critically, they interact. A cost optimization degrades quality. A context problem masquerades as a model problem. Reliability work is invisible until the trace shows you what the fallback did.
Cost and Quality Are Coupled
It’s tempting to treat these as separate workstreams owned by separate people. They aren’t. Every lever that reduces cost, a smaller model, a shorter context window, fewer retrieved chunks, an aggressive cache, moves quality. Every lever that raises quality tends to cost more.
The job of observability here is not to pick a side. It’s to make the trade-off visible and deliberate rather than accidental. Teams that instrument only cost get quietly worse answers. Teams that instrument only quality get a surprise invoice.
Per-Request Attribution, Not Per-API-Key
The cost of a call is input tokens plus output tokens, multiplied by that model’s price and output tokens are usually priced higher than input.
The mistake that costs teams the most time isn’t overspending, it’s aggregate-only tracking. Cost has to be attributable per request, per user, per project, per feature. Otherwise the team can see the bill but can’t act on it.
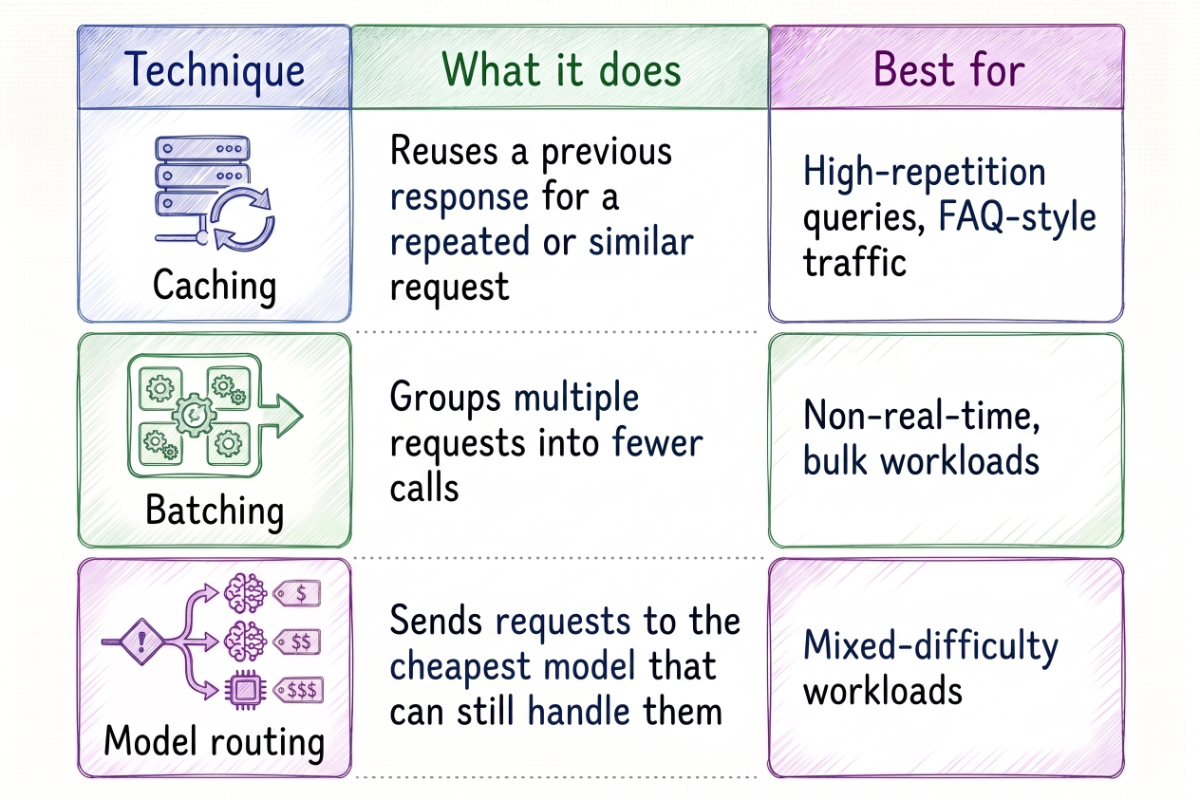
The Three Levers
The Three Levers
Model routing deserves a note, because it does double duty. Most teams reach for it as a cost lever, route the easy 80% of traffic to a small model, and escalate the rest. One effective pattern is an entry-point classifier: a small, cheap local model whose only job is to read the incoming request and decide which tier to route it to. It takes real prompt engineering to get right, but it turns a flat, expensive bill into a tiered one.
The second job is reliability, and we’ll come back to it.
Observability Has a Bill Too
Instrumentation is not free. Logging, tracing, token accounting, and running evals all consume compute and storage, and deeper instrumentation costs more to run. This is not an argument against observability; it’s an argument for being intentional about depth.
Decide the risk level of the project first, then decide how much you instrument. Nobody needs a full trace of the ten thousand requests that went fine. Everybody needs a full trace of the eleven that didn’t.
Measuring Quality Without Reading Every Answer
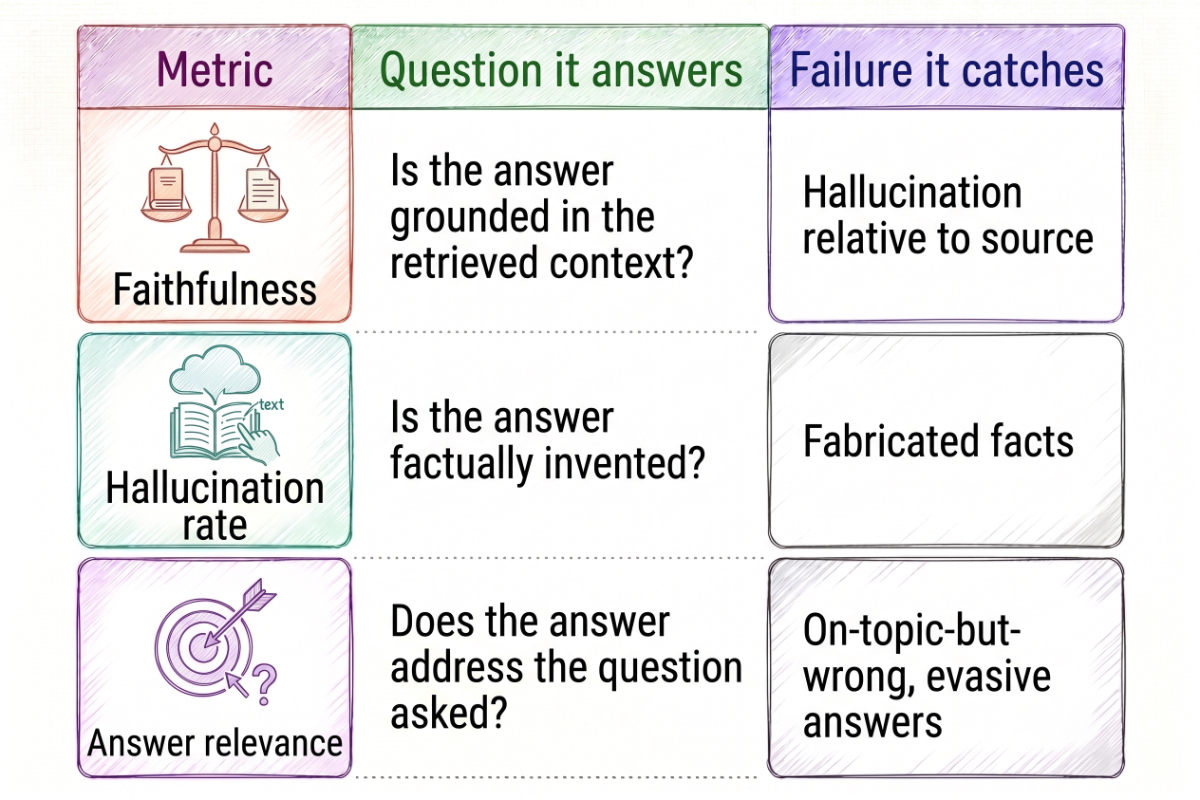
At any real scale, manually reading model outputs stops being an option. Quality has to become a number you can track over time, which means two things: evals and drift.
Evals are scored tests that assign a value to output quality. They can be automated, human-in-the-loop on a sample, or LLM-as-judge. Drift is the shape of that number over time, and the reason to watch the trend rather than any single snapshot.
The dangerous kind of drift is the kind that happens when you changed nothing. Same model, same prompt, same pipeline, and the score still slides. That usually means something upstream moved: documents were updated, ground truth shifted, user behavior changed, or the provider silently updated the model behind the endpoint.
Two rules follow from these definitions, and both are learned the hard way:
Never use relevance alone as a quality gate. It’s the easiest metric to compute and the easiest to pass.
Never combine relevance and faithfulness into a single “quality” score. Averaging them destroys the exact signal you need. Run them in parallel and keep them separate.
The Quality Trap: High Relevance, Low Faithfulness
One of the most dangerous LLM failure modes is an answer that sounds right.
Imagine a user asks:
“What is our refund policy?”
The system retrieves a document about customer support and the model produces a polished explanation.
The answer is relevant.
But the retrieved document does not actually support the specific policy described.
A naive quality score may miss this.
For that reason, relevance and faithfulness should be evaluated separately rather than collapsed into one overall number.
High relevance is not proof of correctness.
Evaluators Are Not Ground Truth
One more thing worth saying plainly, because it rarely makes it into tooling documentation: the evaluator can be wrong too.
In the retention-policy case above, an automated faithfulness scorer marked the answer as fully grounded. It should have been closer to 90%. The evaluator saw an answer whose claims traced back to a retrieved document, and that’s technically what happened; it just wasn’t the right document. Semantic scoring is itself a model-based judgment, with its own failure surface.
This isn’t a reason to skip evals. It’s a reason to treat eval scores as a signal to investigate rather than a verdict to trust, and to keep traces around so you can go look at what was actually retrieved when a score seems suspicious.
Context Is a Cheaper Lever Than a Bigger Model
When output quality is disappointing, the reflex is to upgrade the model. Sometimes that’s correct. More often, the model is capable enough and simply wasn’t given the information it needed.
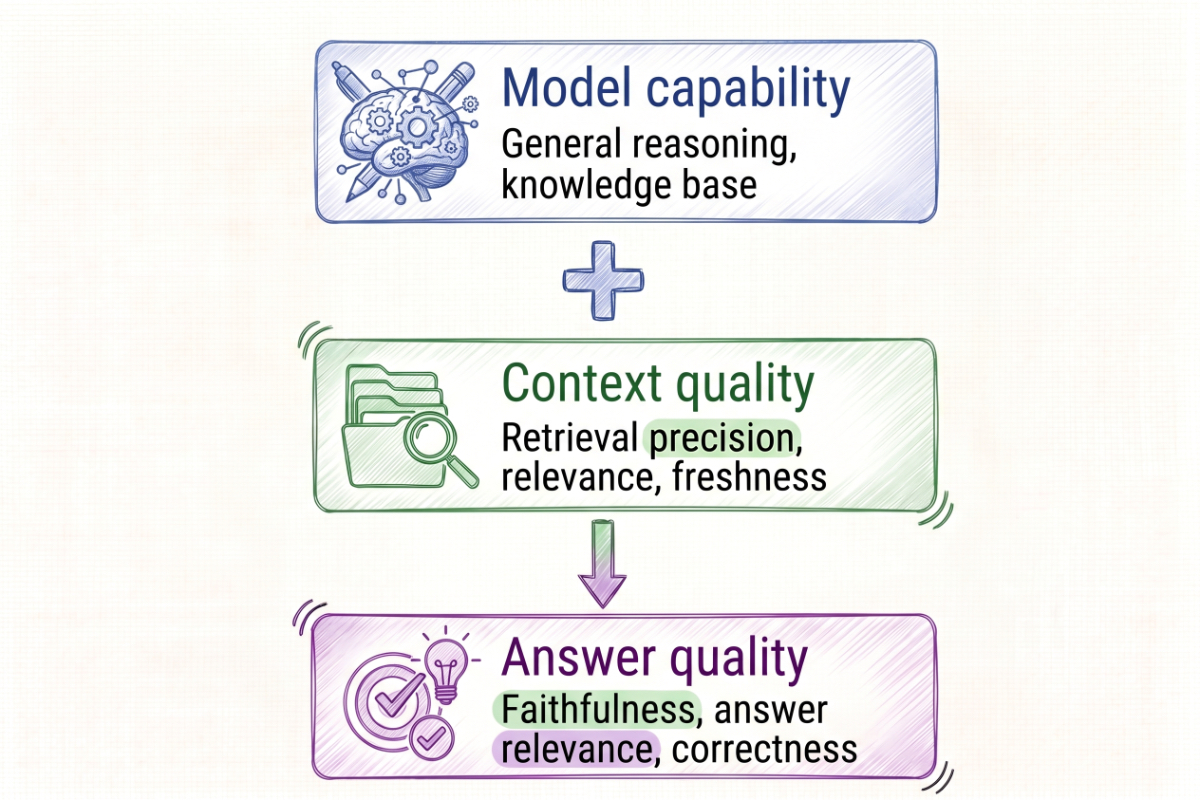
Answer quality is a function of two inputs, not one:
A small model with strong contextual retrieval frequently matches or beats a large model with weak retrieval, at a fraction of the cost per request. That’s not a marginal optimization; it’s the difference between two very different bills for the same faithfulness score.
Context Has Layers
Part of the problem is that “context” gets used as a synonym for RAG. It isn’t. What reaches the model is assembled from several distinct layers, each with its own failure modes.
Contextual retrieval improves the precision of that assembly: re-ranking, query expansion, and metadata enrichment, rather than searching and dumping whatever comes back.
Is It the Context or the Model?
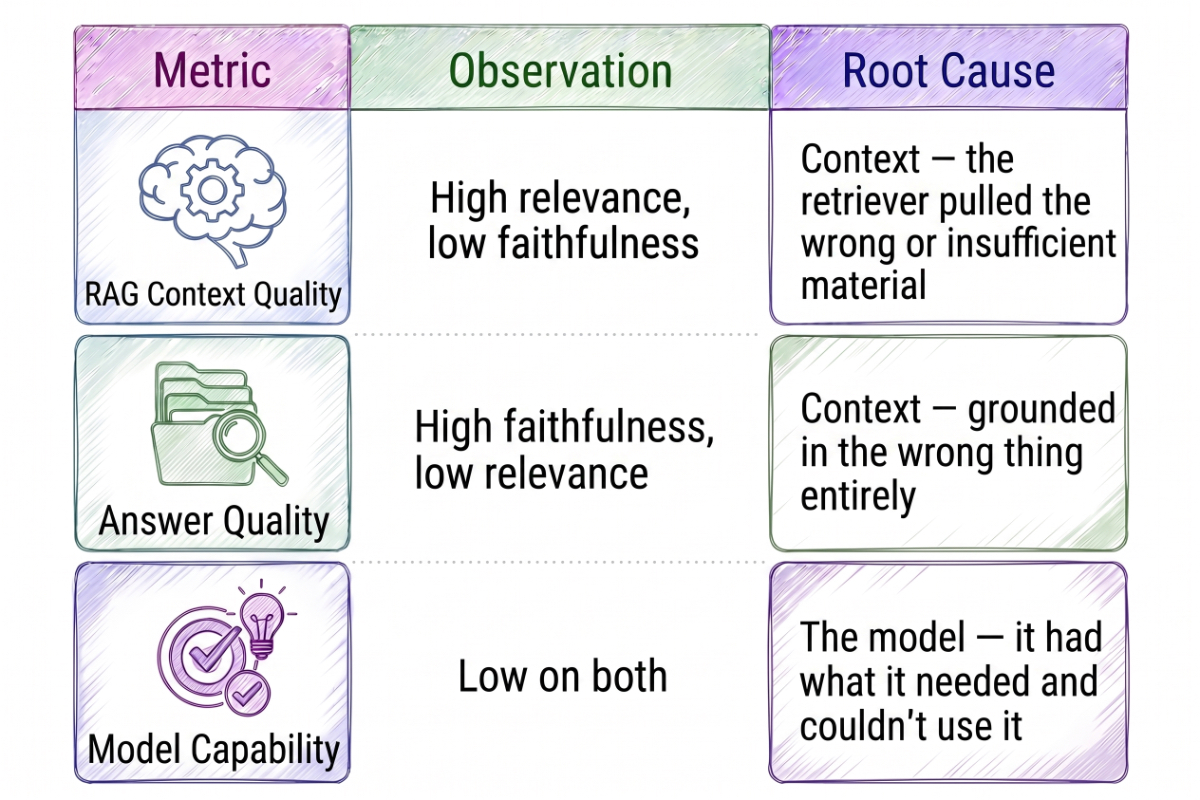
The two quality metrics, read together, are a surprisingly good diagnostic:
The practical move is to isolate the context variable first. Work on retrieval, chunking, re-ranking, and the source documents themselves. Only after the context layer is genuinely improved and quality is still poor does upgrading the model become the rational next step. Done in the other order, you pay more and learn nothing.
Stale Context: Passes Every Check, Still Wrong
There’s one failure category that deserves its own name, because it defeats everything above.
A refund policy changes from 48 hours to a 14-day window. The document is updated. The index isn’t. A user asks, and the system returns a fluent, perfectly grounded answer citing 48 hours. Faithfulness scores high, because the answer is faithful to the chunk it retrieved. The chunk is just obsolete.
No semantic metric catches this, because none of them know what time it is. The fixes are deterministic rather than semantic: freshness metadata on every chunk, staleness thresholds that alert when indexed content ages past a limit, and re-indexing triggered by document updates rather than by a schedule you hope is frequent enough.
Reliability: The Failure the User Never Sees
A production LLM application will eventually encounter:
Provider outages
Rate limits
Timeouts
Transient errors
Model-specific capacity limits
Dependency failures
These are not theoretical edge cases at scale.
The production question is not whether failures happen.
It is whether the application can handle them without exposing the failure directly to the user.
Model Routing Is Also a Reliability Mechanism
Model routing is often discussed as a cost optimization technique.
It can also be part of the reliability layer.
A gateway can handle provider selection, routing, caching, and failover so that application logic does not have to implement every provider-specific behavior.
Circuit breakers are particularly useful when a provider is consistently failing. Instead of repeatedly sending requests to an unhealthy dependency, the system can temporarily route around it.
Traceability: Reconstructing a Request Span by Span
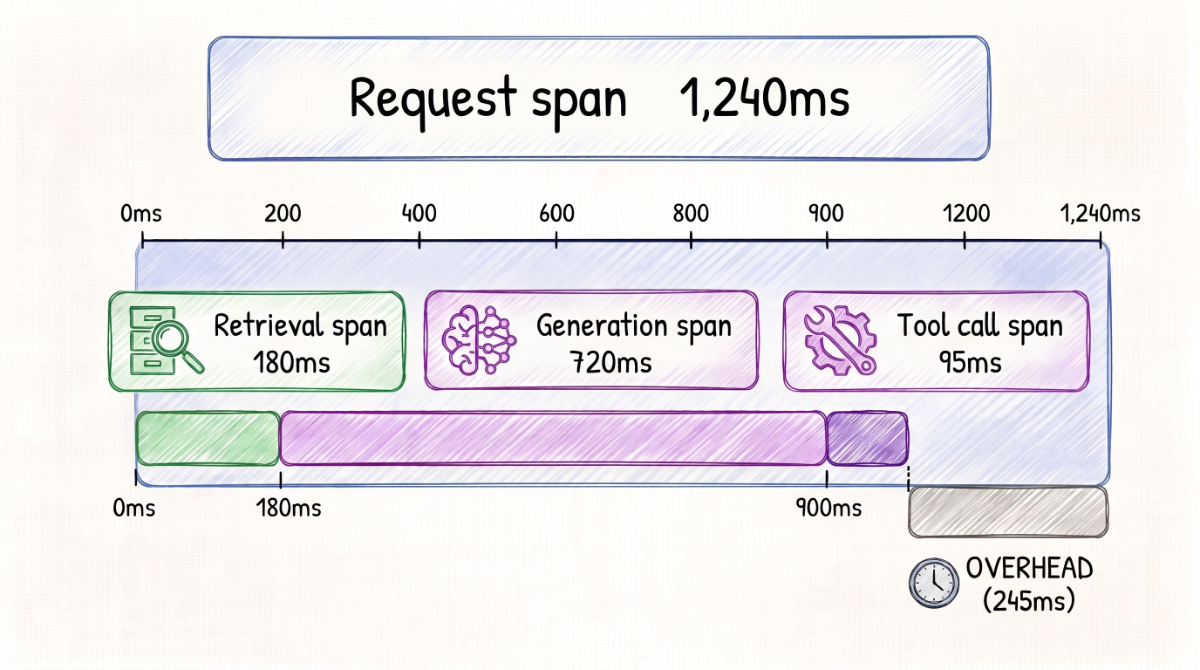
A trace is the record of a request’s full path through your system, broken into spans.
This is the signal that makes the other four debuggable. When a cost spike appears, the trace shows which span consumed the tokens. When faithfulness drops, the trace shows what was actually retrieved. When a user reports a wrong answer, the trace shows whether the model, the retriever, or a tool call produced it.
Standards matter here more than the specific backend. Vendor-neutral instrumentation and consistent span and attribute naming mean your traces stay portable when you change observability vendors, which you will.
Why MCP Makes Tool Calls Observable
Tool use is where traces usually go dark, and it’s worth being precise about why a standard protocol helps.
With hand-rolled tool calling, every integration is implemented in your codebase and instrumented individually. Change a tool, and you change code and instrumentation. Add a tool, and you write both again.
MCP standardizes the shape of a tool call. The agent queries the server for available tools, the model reads what each tool needs and returns, and it formulates the call. Without a standard shape, every tool integration needs its own bespoke instrumentation, and in practice, that means most of them don’t get any.
With one, every tool call is a span with the same structure: name, inputs, duration, status, cost. A single user question like “how is the current sprint going, and how’s the team doing?” might chain four read-only calls, active sprint, board state, project dashboard, team performance, and each one appears in the waterfall, individually inspectable, before the generation span that turns them into an answer.
Traces as a Feedback Loop
One pattern worth stealing: once traces are persistent and structured, they become training data for your own system. A scheduled background job can read successful and failed workflows from the observability backend, identify patterns that distinguish them, and propose prompt improvements. Observability stops being purely diagnostic and starts being an input to iteration.
Production-Ready AI Is About Knowing What Happened
LLM systems introduce a new operational reality.
The application can be available while the answer is wrong.
The model can be working while the context is stale.
The response can be relevant while being unsupported.
The system can be correct while becoming too expensive to operate.
And a provider can fail while the application still needs to serve users.
That is why production LLM observability cannot stop at latency, error rates, and infrastructure metrics.
Teams need visibility into cost, quality, context, reliability, and traceability, tied together at the request level.
The objective is not perfect observability.
It is enough visibility to detect problems, understand their causes, and act before those problems become user-facing failures.
Because in production, the question is not whether an LLM system will behave unexpectedly.
It is whether your team will know before your users do.
FAQ
What is LLM observability?
LLM observability is the ability to understand how an LLM application behaves across the full request lifecycle. It goes beyond traditional metrics such as latency and error rates by providing visibility into signals such as cost, output quality, context, reliability, and traceability.
Why is LLM observability important?
LLM applications can fail silently. A request may complete successfully from a technical perspective while still producing an incorrect, unsupported, or outdated answer. Observability helps teams identify these problems before users become the first to notice them.
What should teams monitor in an LLM application?
Teams should monitor five key signals: cost, quality, context, reliability, and traceability. Together, these signals help teams understand how much a request costs, whether the output is useful and supported, whether the model received the right context, how reliably dependencies perform, and what happened across the request pipeline.
How is LLM observability different from traditional application monitoring?
Traditional monitoring focuses primarily on technical failures such as errors, latency, and infrastructure health. LLM observability also needs to account for semantic failures, where the system technically succeeds but produces a hallucinated, irrelevant, unsupported, or outdated response.
How can observability help identify LLM hallucinations?
Observability can help teams evaluate output quality and trace a response back through the request pipeline. By examining the retrieved context, prompt, model response, tool calls, and evaluation signals, teams can investigate whether an unsupported answer resulted from poor retrieval, stale context, model behavior, or another part of the system.
Share this article
Share on LinkedIn, send by email, or copy the direct link.