
AI Solar Soiling Detection: How Operators Stop Losing Generation to Soiling
Discover how AI solar soiling detection identifies losses, optimizes cleaning schedules, and recovers up to 30% lost output.
June 18, 2026
10 minutes read
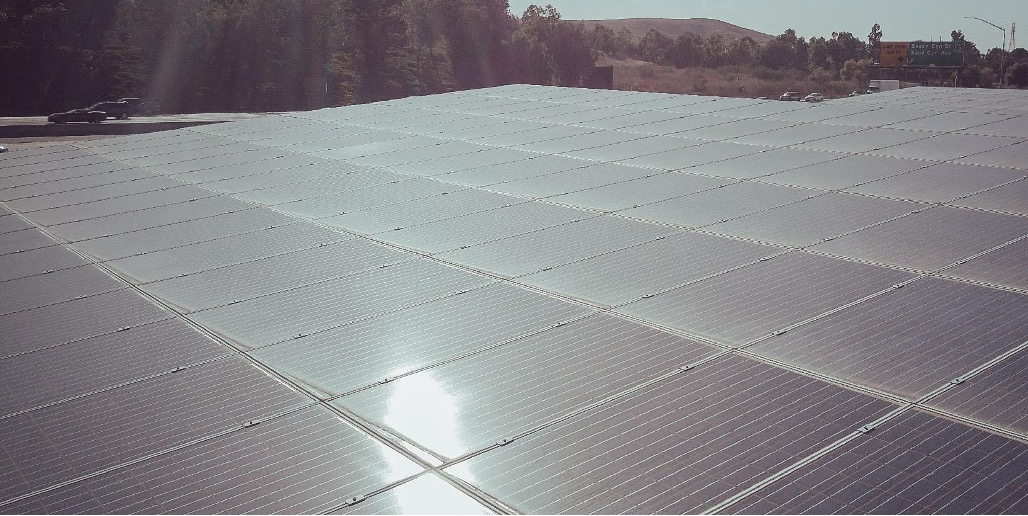
A plant manager at a 32 MW solar facility reviews monthly performance against projections. Equipment availability is above 99 percent. No inverter faults, no string alerts, no incidents logged. Generation is still 8 percent below projection, caused not by a fault but by soiling that accumulated across six weeks and went entirely undetected.
Soiling is one of the most consistent sources of generation loss in solar. Dust, pollen, bird droppings, and agricultural residue block irradiance from reaching the cells, with losses ranging from 3 percent at temperate sites to 30 percent at arid sites between cleaning cycles. The loss builds every day and never produces an alert.
This article covers how AI soiling detection closes that gap, what the cleaning optimization ROI looks like at operational scale, and which sites carry the most revenue exposure to soiling.
How AI Soiling Detection Works: From String-Level Maps to Real-Time Alerts
AI soiling detection works by continuously analysing generation output patterns against expected performance at the string and zone level, cross-referenced with irradiance, temperature, and weather data. The model learns what clean-panel output looks like at every irradiance level and time of day for that specific site, and flags deviations that match the signature of soiling accumulation rather than shading, degradation, or equipment faults.
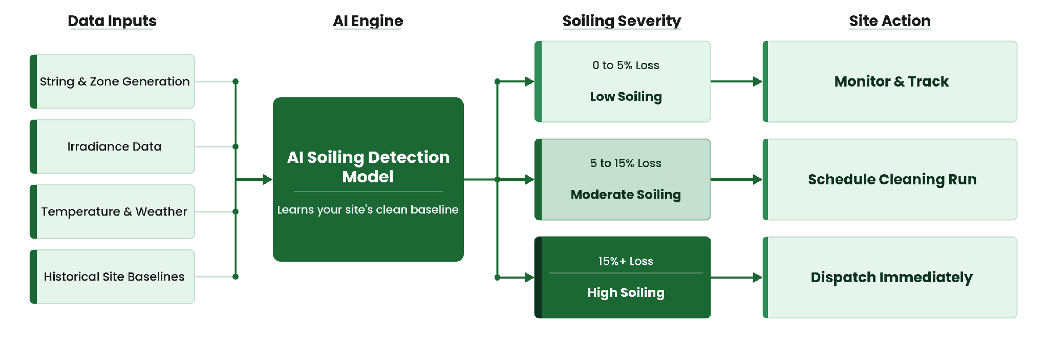
How AI soil detection classifies zones by severity and triggers the appropriate site action.
The operator’s output is a live soil map of the entire site. Individual strings and zones are ranked by soiling severity with a daily dollar value attached to each loss event. An operator looking at that map knows exactly which zones need cleaning, what it costs per day to leave them uncleaned, and whether the revenue case for a cleaning run is justified.
The detection runs continuously without any inspection cycle. There is no need to send crews into the field to assess soiling levels, no reliance on visual estimation, and no lag between soiling accumulation and detection. On a high-exposure site in a dusty environment, soiling events that previously went unnoticed for weeks are identified within hours of reaching a loss threshold defined by the operator.
The isolation capability is what separates AI soil detection from performance monitoring. When a string underperforms, the cause matters as much as the fact. Soiling needs a cleaning crew; shading needs a vegetation review; degradation needs an inspection; an equipment fault needs a maintenance dispatch. AI soil detection separates these causes simultaneously from the same data, so the response matches the actual problem.
What Standard Monitoring Misses and How AI Catches It
Standard monitoring platforms produce performance ratio alerts, irradiance comparisons, and availability dashboards. These tools are well-suited to detecting equipment faults and availability losses. They are poorly suited to isolating soiling as a cause of underperformance, and the gap between what they detect and what they can diagnose is where soiling revenue loss accumulates unmanaged.
Performance Ratio Alerts: The Underperformance Without a Cause
A performance ratio alert tells an operator that output is below expected. It does not say why. Soiling, shading, inverter clipping, and degradation all produce the same PR signature at the dashboard level, and distinguishing them without a physical inspection delays the response and adds cost to a problem that a cleaning crew could have resolved in hours.
Irradiance Sensors: Measuring Light, Not Loss
Irradiance sensors measure the solar resource available at the site at sensor height. They do not measure how much of that resource reaches the active cell surface on each panel. A pyranometer mounted at the end of a string records 850 W/m2 of available irradiance, regardless of whether the panels in that string are clean or coated with two weeks of accumulated dust. The sensor confirms the sun is shining. It cannot confirm how much of that light the panels are actually converting.
Nameplate Baselines: Forecasting a Plant That No Longer Exists
Standard monitoring compares actual output against nameplate expectation. As soiling and degradation accumulate over operating years, the expected output figure drifts from what the plant is actually capable of producing. The platform flags deviations that include degradation, seasonal variation, and soiling simultaneously, and standard monitoring cannot separate them.
AI catches what each of these tools misses by modelling the site at a level of granularity that separates causes. Where standard performance monitoring produces an alert that something is underperforming, AI soiling detection produces an alert that zone B has accumulated soiling equivalent to a 9 percent generation loss, that the revenue cost of leaving it uncleaned today is $340, and that a cleaning run is justified at current generation prices. That is the difference between monitoring and actionable intelligence.
Real-World Results: What AI-Guided Cleaning Delivers
Across arid, semi-arid, and agricultural deployment environments, AI-guided cleaning programs outperform fixed-schedule baselines on both generation recovery and cleaning cost reduction. Two deployments illustrate what that looks like at the operational scale.
38 MW Arid Site: Cleaning Triggered by Revenue, Not Schedule
At a 38 MW plant in a high-dust arid environment, soiling was causing generation losses of 18 to 22 percent at peak periods. The site was running 20 scheduled cleaning cycles per year, 8 of which the AI platform identified as dispatched below the revenue threshold that justified the cleaning cost.
The schedule was restructured to 11 targeted runs, timed to intervene when generation loss crossed the cleaning cost threshold. Generation recovery improved by 16 percent. Cleaning costs reduced by 38 percent. The platform cost was recovered within 7 months of deployment.
24 MW Agricultural Site: Separating Pollen Loss from Equipment Faults
At a 24 MW agricultural site, the fixed 10-run schedule was consistently misaligned with the actual soiling pattern. The heaviest events fell during the spring pollen season and post-harvest periods, neither of which fell within the schedule windows. AI detection identified three high-severity soiling events that the schedule was missing, and five runs were dispatched during low-soiling winter months when panels were largely clean.
The schedule was reduced to 7 targeted runs, timed to coincide with the detected soiling events. Generation recovered by 11 percent in the first operating year. Cleaning costs reduced by 32 percent.
The Cleaning ROI: From Fixed Schedules to Data-Driven Decisions
Most operators on a fixed cleaning schedule are running two problems simultaneously. On some sites, the schedule sends crews when panels are clear, and the cost is not justified. On others, it misses peak soiling events where generation loss far exceeds what a cleaning run would cost. Both errors run in parallel, on the same schedule, every year.
| Metric | Fixed Schedule | AI-Optimized |
| Decision basis | Calendar interval | Revenue threshold per zone |
| Cleaning frequency | Fixed (e.,g. monthly or quarterly) | Triggered by soiling severity |
| The whole | The whole | Highest-loss zones prioritised first |
| Unnecessary run risk | High — crews dispatched regardless of soiling level | Eliminated — every run is revenue-justified |
| Water and crew usage | Predictable but wasteful | Reduced 20 to 40% through targeted dispatch |
| Revenue recovered per run | Variable — some runs recover little | Maximised — dispatched at peak soiling |
The Over-Cleaning Problem
According to NREL O&M benchmarking, a standard cleaning run costs between $600 and $1,400 per MW, making a single unnecessary run on a 20 MW site $12,000 to $28,000 in avoidable spend. Operators running 12 to 18 scheduled runs on sites that AI analysis shows require 7 to 10 targeted interventions are absorbing that cost on every unnecessary dispatch with no generation benefit.
The Under-Cleaning Problem
At $55 per MWh, a 10 MW plant loses approximately $8,250 per MW per year for every 1 percent of average soiling. A site operating at an average soiling of 8 percent between fixed cleaning cycles is losing $66,000 per MW per year in generation revenue. When the fixed schedule misses a peak soiling event because the calendar date has not arrived, that delay costs revenue every day the panels stay uncleaned.
How AI Calculates the Exact Trigger Point
AI calculates the cleaning trigger by comparing daily revenue loss from soiling against the amortised cost of a cleaning run. The calculation updates continuously and factors in generation price, the 48- to 72-hour forecast window, water availability, and labour and logistics costs. When revenue loss crosses the cleaning cost threshold, the platform issues a cleaning recommendation with the financial justification attached.
The same AI model that calculates the cleaning trigger also feeds the yield forecasting system with real-time soiling loss data. Hence, the generation forecast already reflects the current panel condition rather than the nameplate assumption. Operators receive a cleaning trigger and a forecast, both of which reflect the same ground truth.
Which Solar Sites Have the Most to Lose from Soiling
Soiling affects every solar site, but revenue exposure is highest where soiling rates are highest, and the mismatch with fixed schedules is greatest. Arid and semi-arid environments experience dust accumulation that, per IEA PVPS Task 13 research, can build to 15 to 30 percent generation loss within two to four weeks of a cleaning run. At these sites, the question is not whether to clean frequently, but whether each run is timed to maximize revenue recovery.
Agricultural sites carry a different soiling profile. Pollen season, harvest dust, and irrigation spray create high-intensity events that are seasonal and unpredictable in timing, typically causing 8 to 20 percent loss in narrow windows. Fixed schedules built around average rates consistently miss the peak events and dispatch during low-soiling months.
Coastal industrial sites accumulate salt spray and industrial particulate,e where soiling can be chemically adhesive, causing higher losses than visual inspection suggests. Temperate and urban sites sit at 3 to 8 percent but are not immune, with bird droppings and localised debris creating string-level hotspots that AI identifies between standard runs.
Deploying AI Soiling Detection: What Integration Looks Like
Asoilng detection integrates with the data infrastructure most operating solar sites already have in place. It does not require hardware changes, physical inspection upgrades, or new sensor installations. Most platforms connect via API to existing monitoring and telemetry systems, continuously pulling generation, irradiance, and inverter data. The first soiling map is typically available within days of the data connection being established.
- Audit your current cleaning schedule against soiling data. Pull 12 months of generation data and map cleaning run dates against performance recovery to identify how many of your current runs were dispatched during low-soiling periods and how many peak soiling events your schedule missed.
- Confirm your data infrastructure. AI soiling detection requires string-level or inverter-level generation data, sub-hourly irradiance data, and at least 6 months of historical generation data. Sites with local weather stations and longer generation histories see faster model calibration.
- Start with your highest-exposure site. Deploy on the site with the highest soiling exposure first. The ROI case is fastest to validate on arid or agricultural sites where soiling rates are high, and the mismatch between fixed schedules and actual soiling patterns is most visible.
- Connect cleaning dispatch to the AI trigger. Confirm that the AI cleaning recommendation integrates with your O&M scheduling workflow before sign-off on any platform. An alert that sits in a dashboard without connecting to a cleaning crew does not generate recovery.
Operators who run AI soiling detection across a full operating year before expanding to additional sites typically achieve a cleaner ROI case and a more accurate cleaning cost model, making the business case for portfolio-wide deployment straightforward to present to asset owners.
Conclusion: Every Cleaning Run Should Be a Revenue Decision
Soiling is not a maintenance problem. It is a revenue problem that happens to have a maintenance solution. Operators treating it as a calendar item, cleaning on fixed intervals regardless of soiling severity or cleaning cost, absorb avoidable losses on every cycle.
AI soil detection changes the decision from a schedule to a calculation. Every cleaning run is triggered when revenue loss exceeds cleaning costs, and data justifies every dispatch. As energy prices rise and water costs increase, the gap between operators running AI-guided programs and those on fixed schedules will widen every year.
Omdena deploys AI soiling detection and cleaning optimization for solar operators and asset managers, delivering string-level soiling maps and revenue-based cleaning triggers. To find out how much your current cleaning schedule is costing your portfolio, get in touch with the Omdena team.