From Orbit to Harvest: Inside TerraYield, a Multimodal Dataset for Smarter Crop Yield Forecasting
Explore TerraYield, a leakage-safe Sentinel-2 agricultural dataset fusing imagery, weather, and USDA reports for precise crop forecasting.

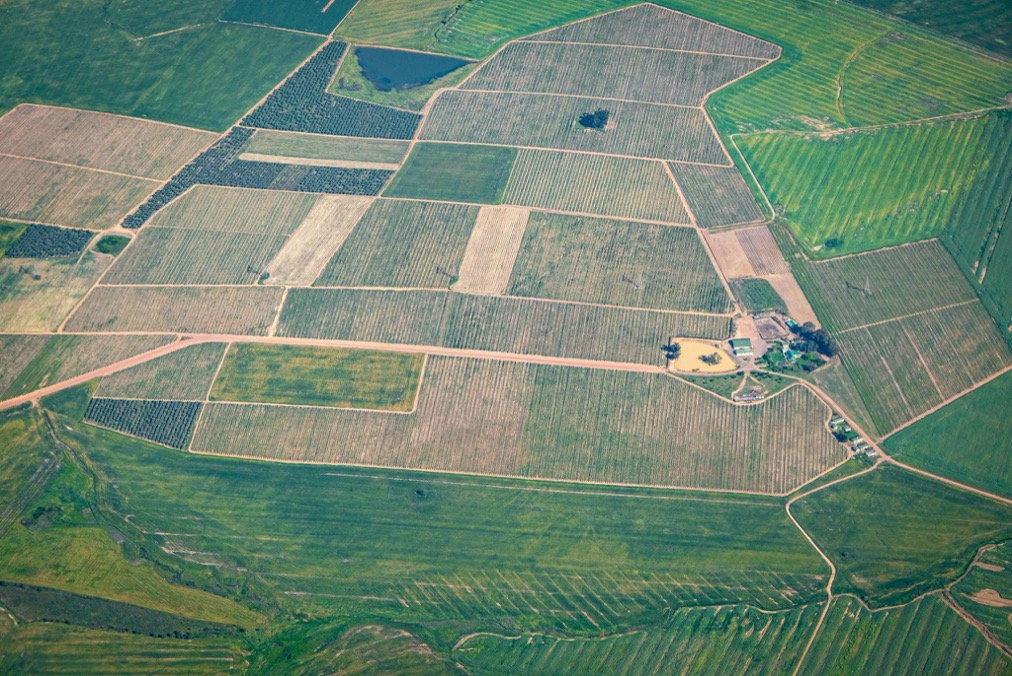
Sentinel-2 land-cover classification over Iowa farmland — TerraYield dataset banner
Welcome to TerraYield, a Multimodal dataset owned by Omdena. Discover how a fused stack of Sentinel-2 agricultural imagery, daily weather, commodity prices, and government reports transforms Midwest farmland into a leakage-safe forecasting engine — and what it takes to scale it.
Section 1 of 8 · Agricultural Intelligence Platform
Seeing Agriculture from a New Perspective
Modern agriculture is no longer just about walking the fields; it is about macro-level intelligence. Predicting crop yields before harvest requires looking beyond standard true-color observation. It demands a fully multimodal approach—correlating the biochemical signatures of the plants with ground-level meteorology, market economics, and regional planting reports.
Enter TerraYield.
TerraYield is a multimodal, leakage-safe agricultural intelligence dataset that fuses Sentinel-2 satellite statistics, daily meteorology (Open-Meteo), commodity market data (World Bank/NASS), and USDA government reports. It is purpose-built for regional crop yield forecasting and land-use change detection across the American Midwest (Iowa and Illinois). For more cutting-edge AI implementations, explore our latest updates on the Omdena blog.
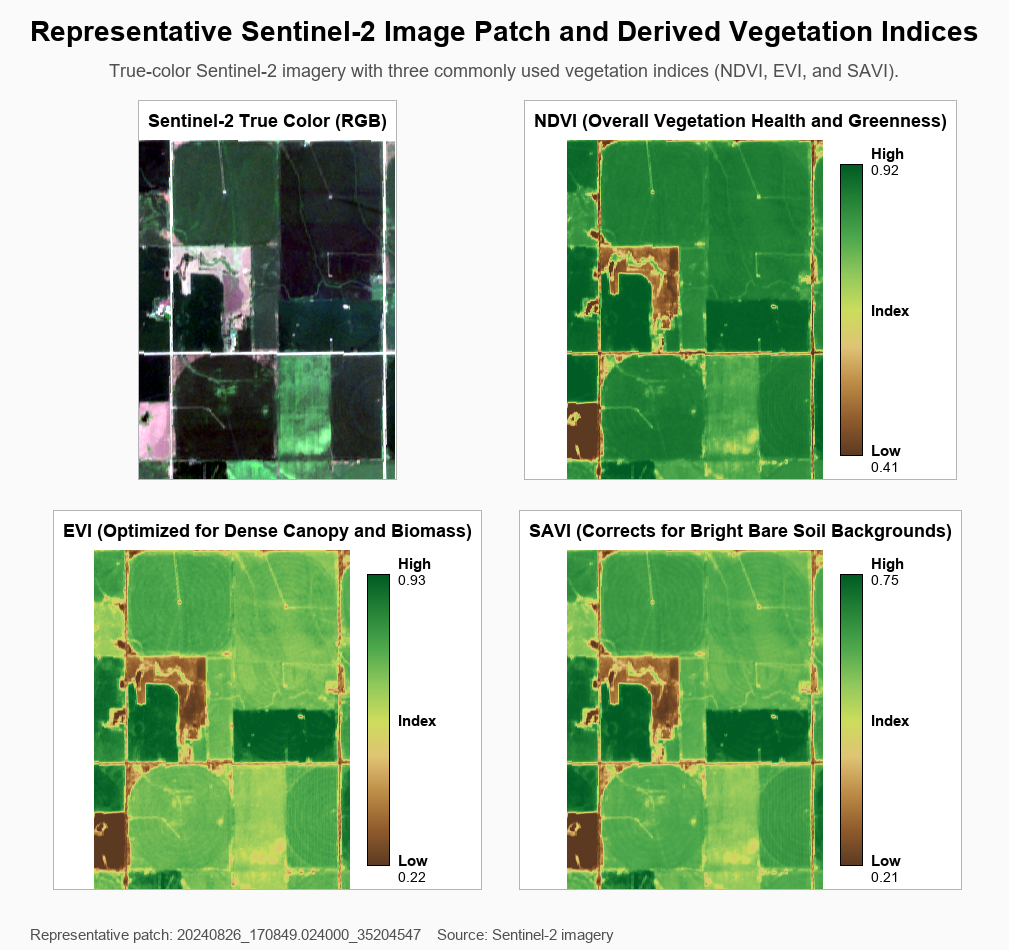
Section 2 of 8 · Beyond RGB Imagery
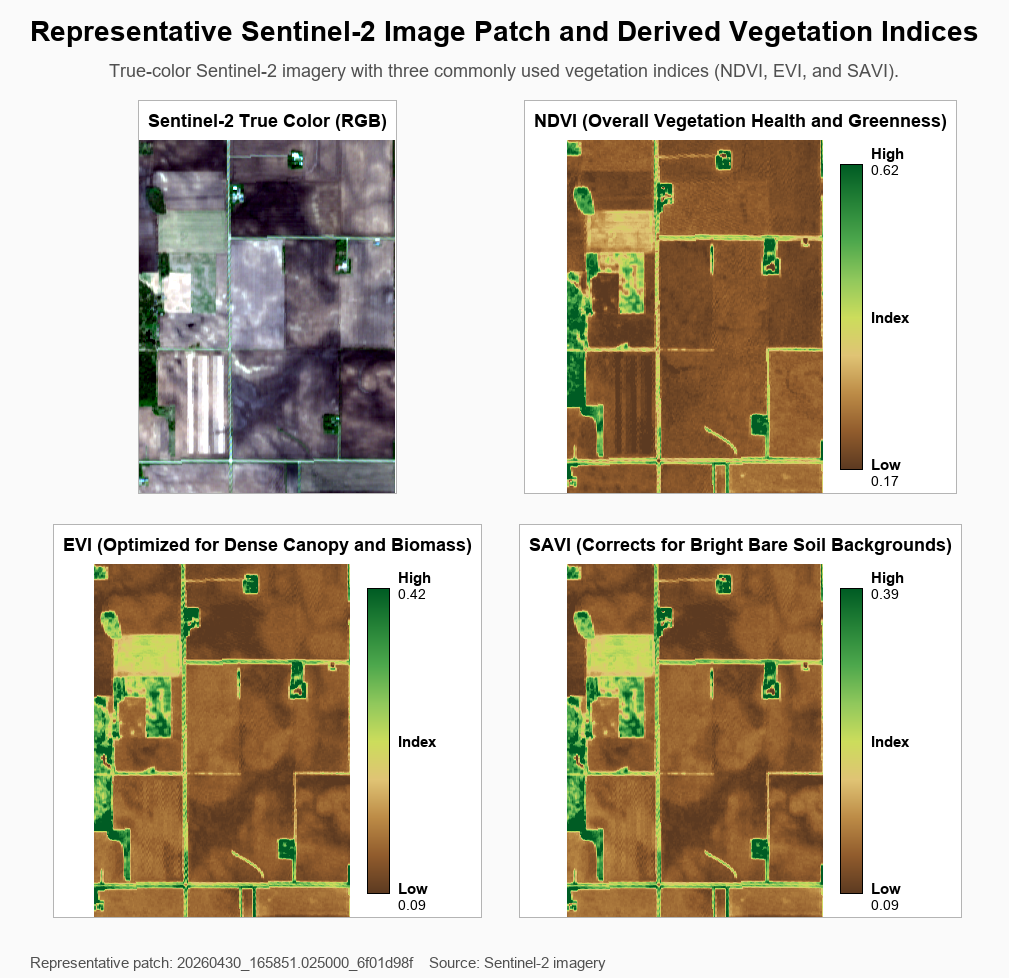
The Big Three Indices in our Sentinel-2 Agricultural Dataset
To build accurate machine learning models for agriculture, a standard RGB image is not enough. The TerraYield pipeline automatically generates and aligns three distinct vegetation indices for every single geographic patch, alongside cloud-masked versions, providing researchers with a complete, multi-layered view of crop health.
- NDVI (Normalized Difference Vegetation Index): The industry standard for overall greenness. It answers the fundamental question: “How healthy is this crop?”
- EVI (Enhanced Vegetation Index): The heavy lifter for dense canopies. It penetrates thick biomass without mathematical saturation, answering: “What is the actual volume and density of these high-yield crops?”
- SAVI (Soil-Adjusted Vegetation Index): The early-stage indicator. It mathematically corrects for the glare of bright, bare earth to answer: “Are the newly planted seedlings emerging successfully?”
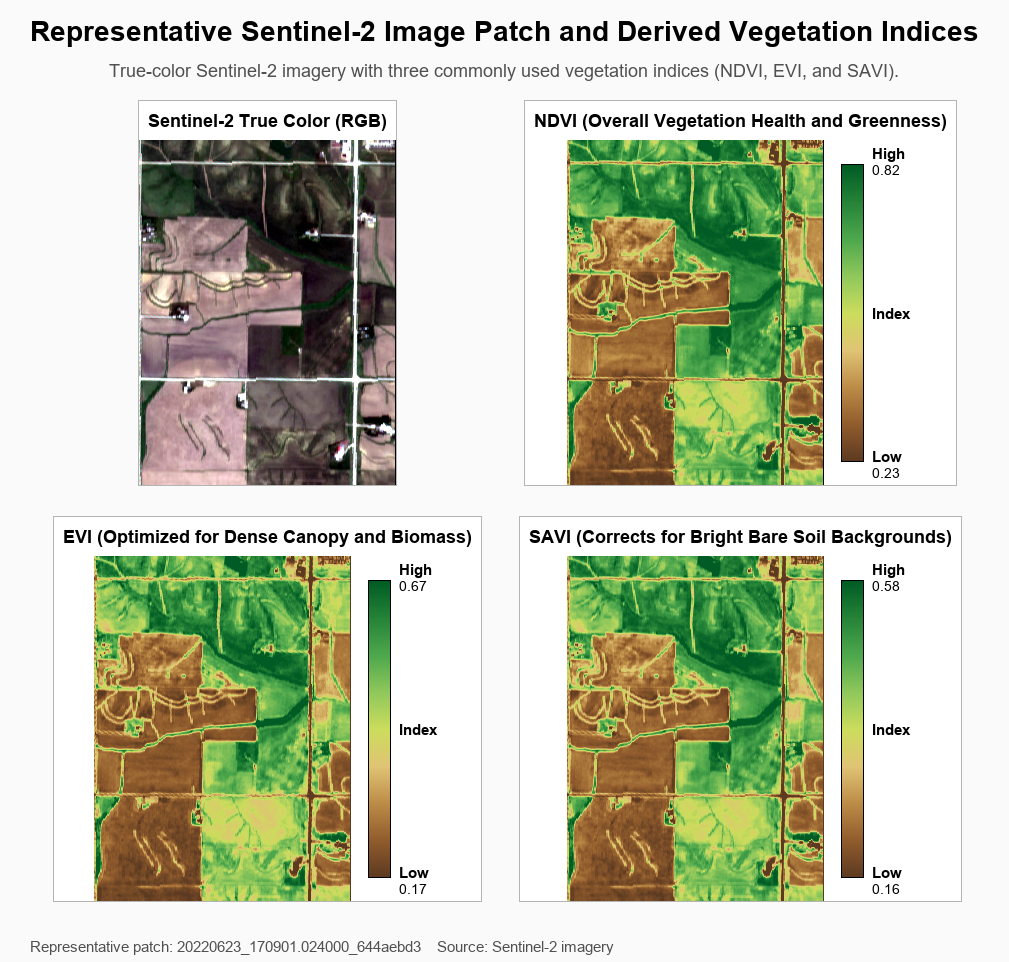
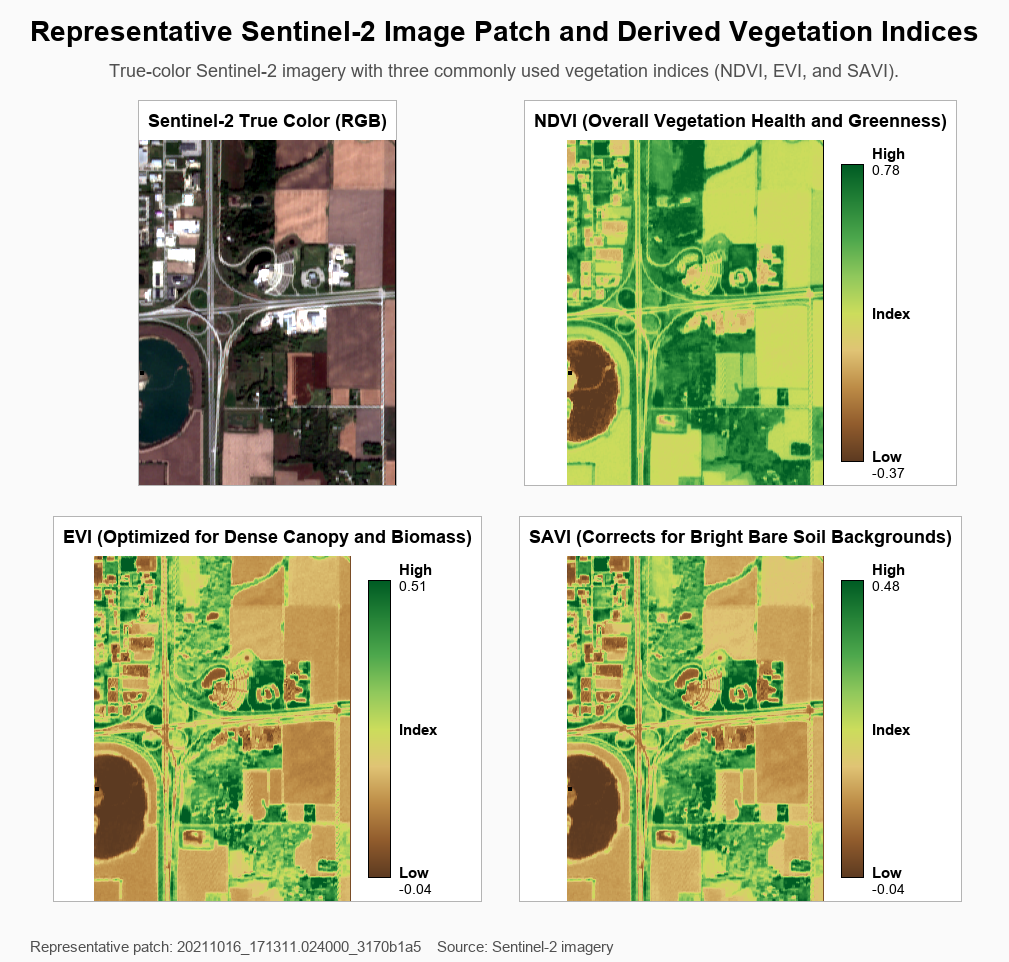
Section 3 of 8 · Real-World Topography
Spotting Precision Agriculture and Complex Boundaries
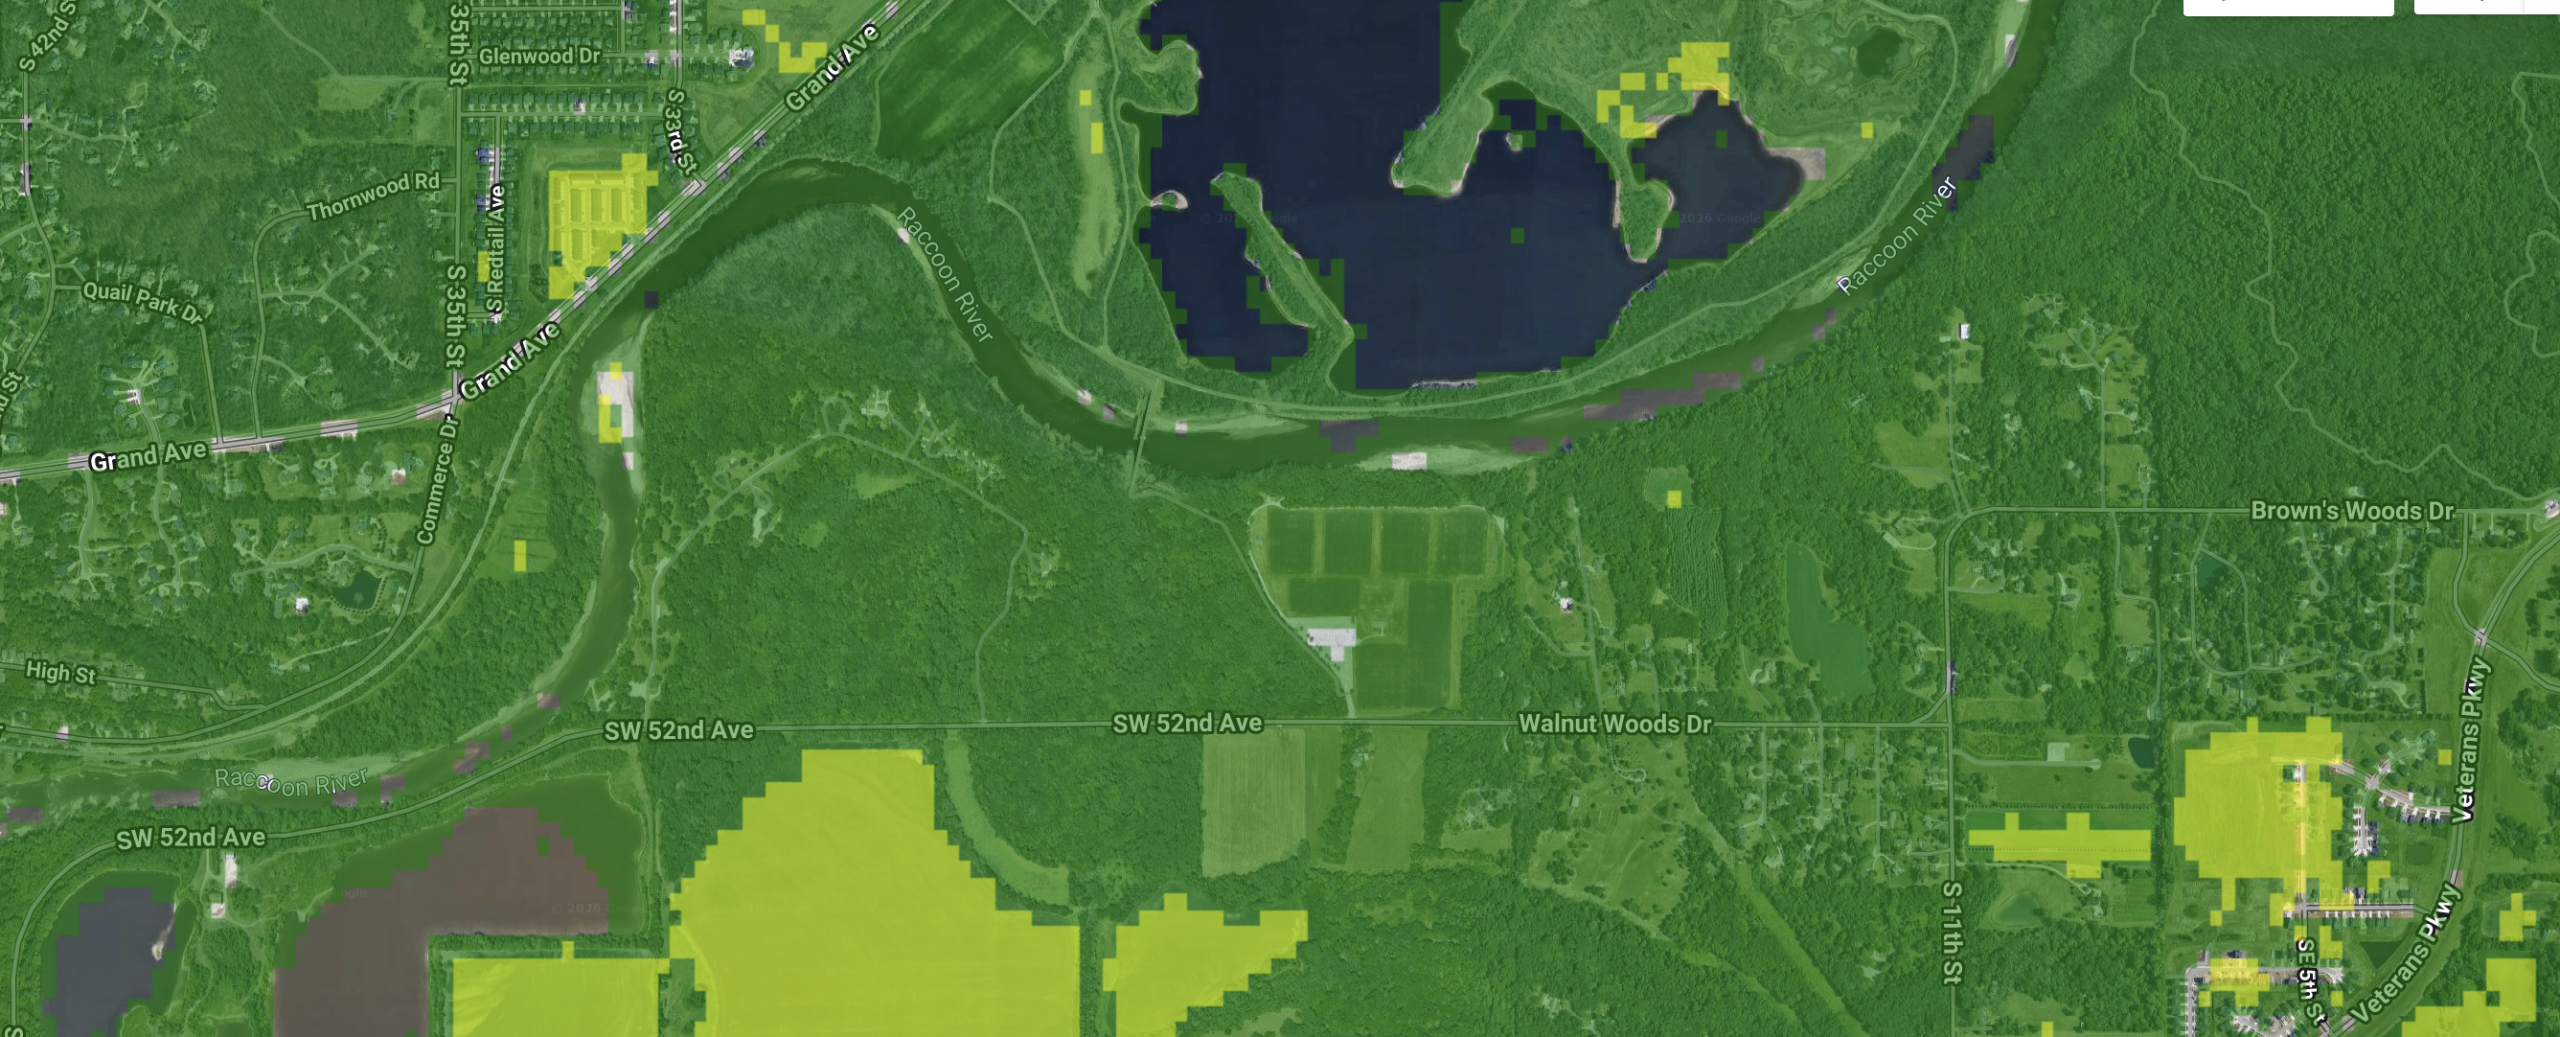
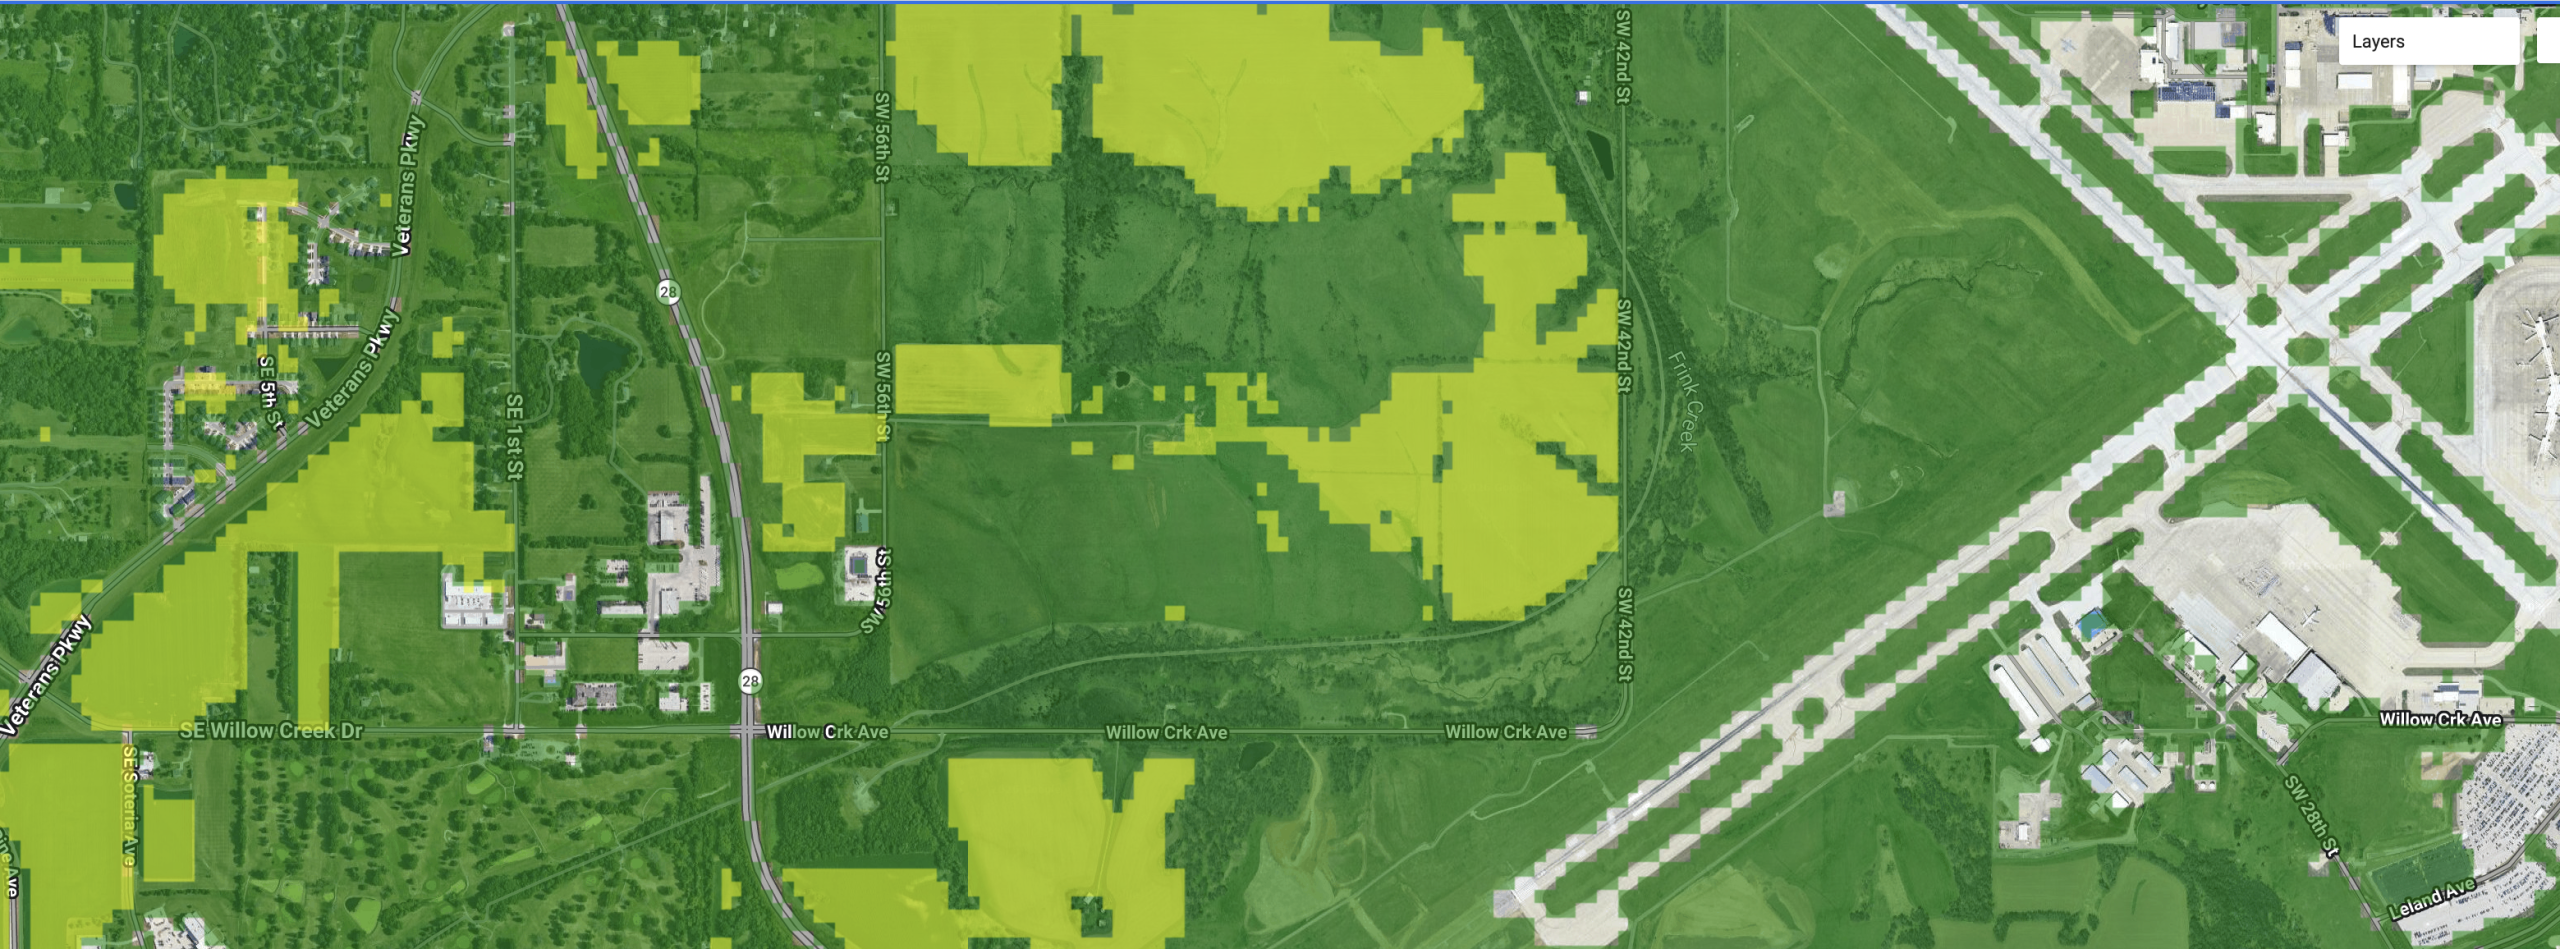
A high-quality dataset must capture complex, modern farming techniques, not just flat, square plots of land. TerraYield’s high spatial resolution allows computer vision models to identify and analyze specific land management practices seamlessly.
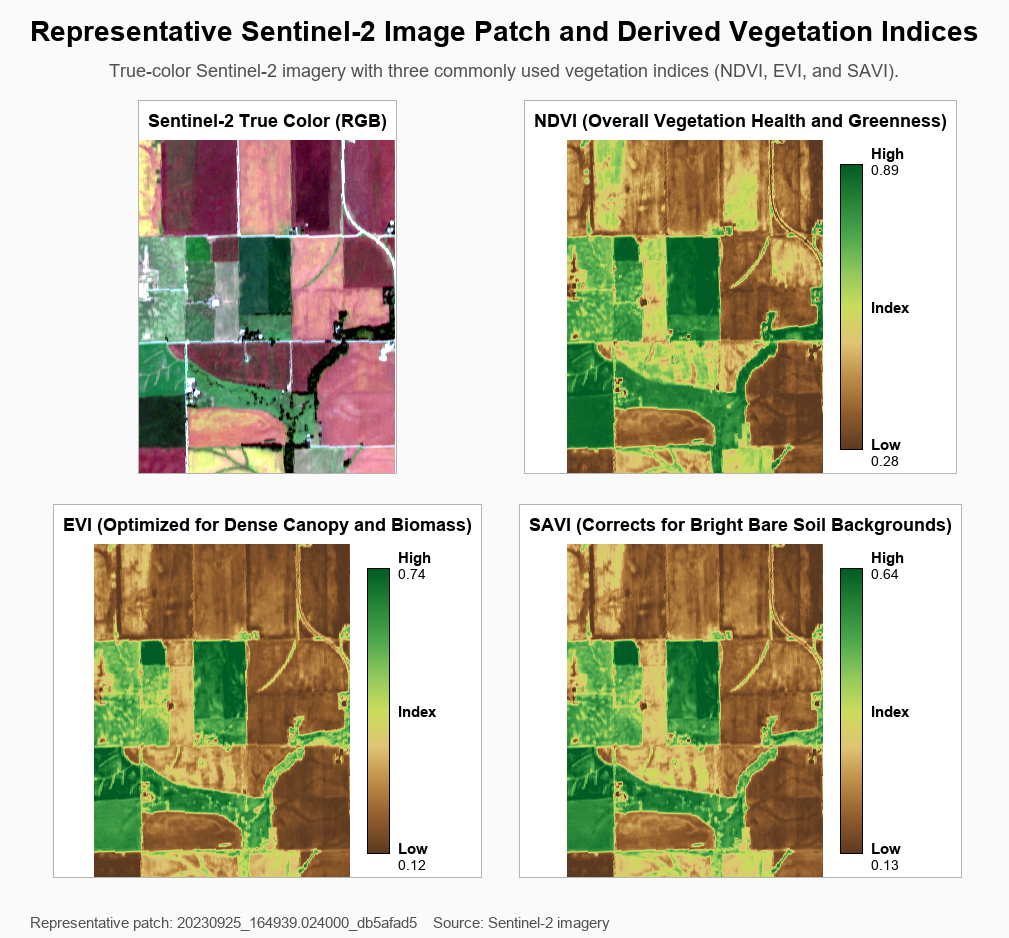
Furthermore, real-world farming intersects with natural rivers, complex topography, and human infrastructure. TerraYield is robust enough to handle these diverse landscapes, ensuring predictive models don’t confuse concrete highways with crop failure, or terraced farming with soil anomalies.
Section 4 of 8 · Dataset Objectives
Why We Built It: Four Core Objectives
Four goals defined TerraYield from day one — and they still shape every design decision in the pipeline.
- Multi-Source Fusion: Integrate Sentinel-2 GEE statistics, daily weather, commodity prices, and USDA government reports into a single temporally-aligned surface using a shared 16-day backbone. Every modality speaks the same temporal language.
- Leakage-Safe Forecasting: Enforce strict cutoffs so models train only on data available before harvest — enabling honest early-season (May), mid-season (July), and pre-harvest (September) yield predictions. No peeking at the answer.
- Regional Yield Prediction: Predict annual yield (t/ha), production volume, and harvested area at state and country level using 108-feature Sentinel-2 statistics across 16-day phenology windows.
- Land-Use Change Detection: Track year-over-year crop rotation patterns, land-use transitions, and agricultural expansion using satellite-derived time-series classification models trained on consistent observations.
Section 5 of 8 · Stakeholder Map
Who Uses This Data?
TerraYield was designed with four distinct stakeholder communities in mind — each with fundamentally different reasons to care about what happens in an Iowa cornfield in July.
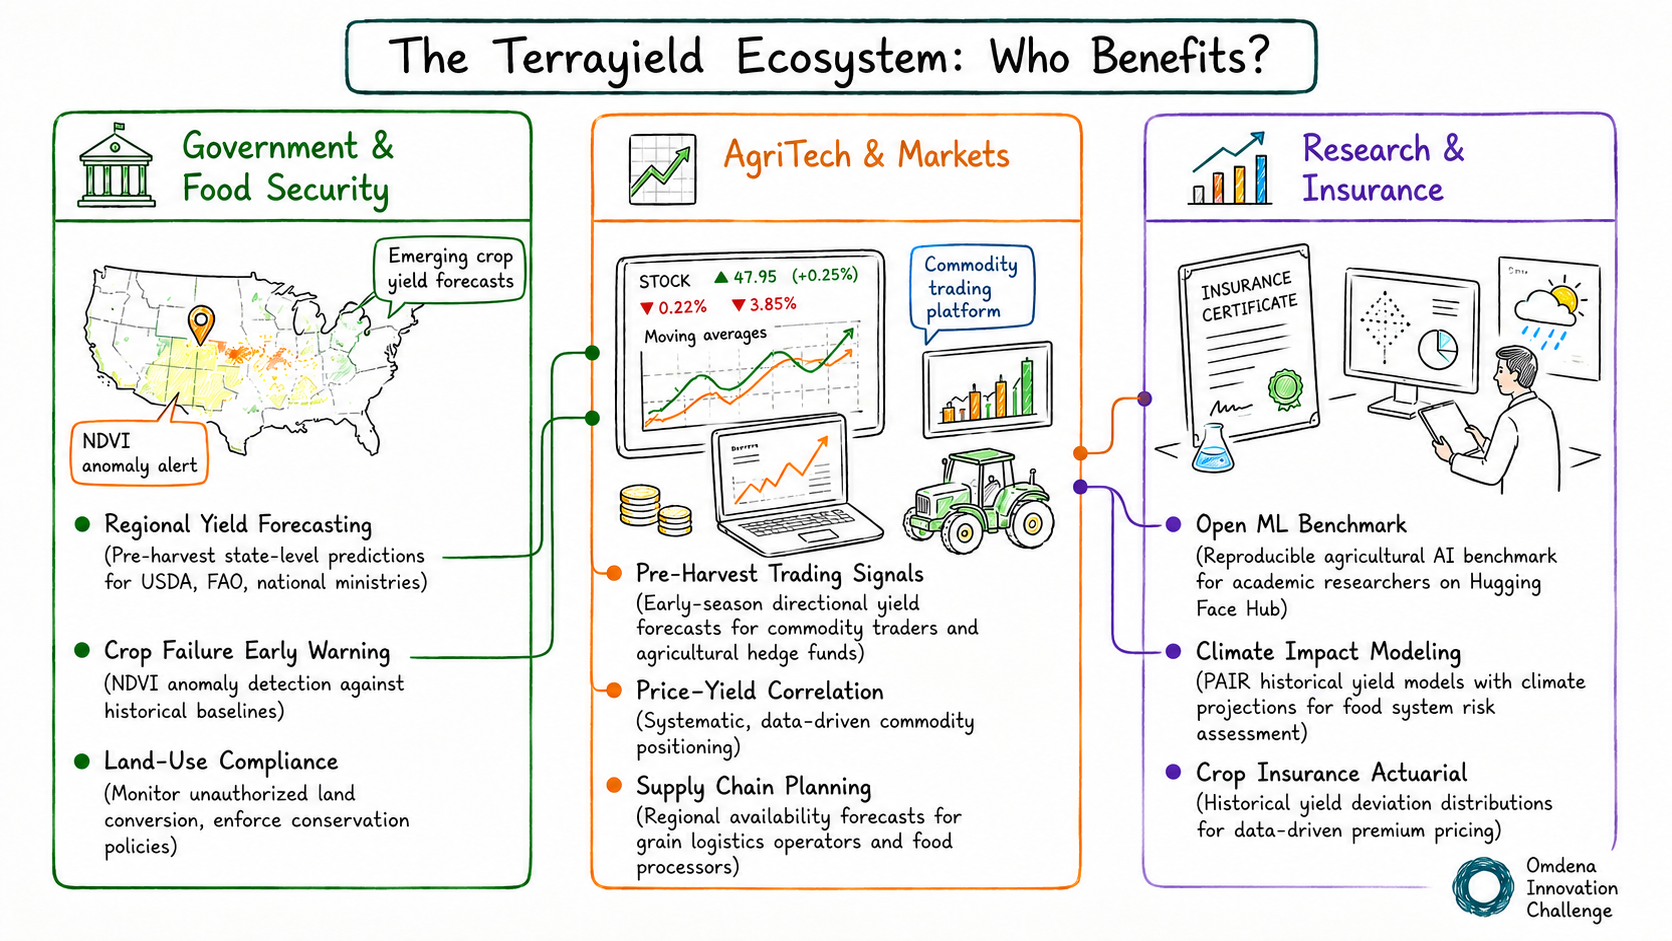
🏛️ Government & Food Security
- Regional Yield Forecasting — Pre-harvest state-level predictions for USDA, FAO, and national ministries to plan food security interventions months ahead of supply shocks.
- Crop Failure Early Warning — NDVI anomaly detection against historical baselines to flag emerging crop stress before it becomes a humanitarian crisis.
- Land-Use Compliance — Year-over-year satellite classification to monitor unauthorized land conversion and enforce conservation set-aside policies.
📈 AgriTech & Markets
- Pre-Harvest Trading Signals — Early-season directional yield forecasts for commodity traders, agricultural hedge funds, and analytics platforms — built on the same phenology signals the market hasn’t yet priced in.
- Price–Yield Correlation — Historical NDVI deviation matched against cash price movement, enabling systematic, data-driven commodity positioning.
- Supply Chain Planning — Regional availability forecasts for grain logistics operators, food processors, and export agencies 3–6 months out.
📊 Research & Insurance
- Open ML Benchmark — A reproducible agricultural AI benchmark for academic researchers, designed to be published on Hugging Face Hub for community use and peer comparison.
- Climate Impact Modeling — Pair historical yield models with climate projections for long-range food system risk assessment and resilience planning.
- Crop Insurance Actuarial — Historical yield deviation distributions and exceedance probability curves for data-driven premium pricing and indemnity modeling.
Section 6 of 8 · Data Maturity Architecture
From Raw Pixels to ML-Ready Features: The Three-Layer Architecture
TerraYield follows a structured data maturity path — from raw ingestion all the way to deployment-grade ML features — across three progressive layers.
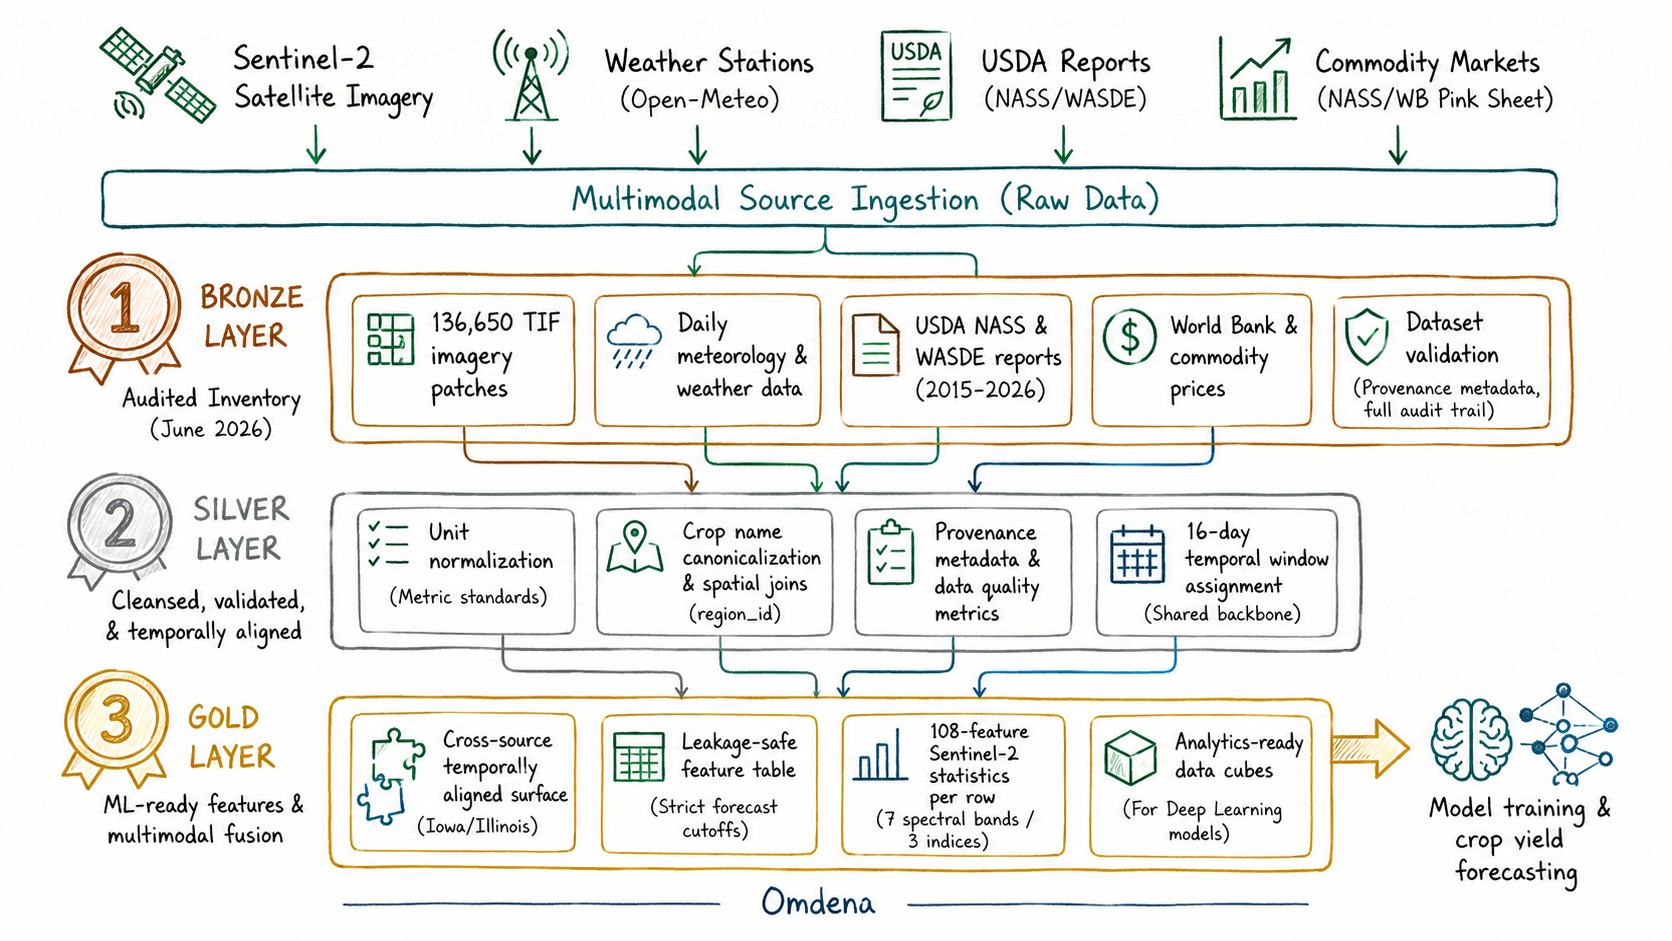
🥉 Bronze Layer — Production-Ready Now
Raw data as ingested from external sources, with schema validation and minimal transformation. Full audit trail preserved. This is the current foundational state of TerraYield.
- Sentinel-2 TIF patches yielding exactly 22,775 unique regional views.
- GEE regional statistics pipeline (
sentinel2_new). - 7 spectral bands · 3 vegetation indices · 10 statistical aggregations per field.
- Daily weather via Open-Meteo (temperature, precipitation, solar radiation).
- Commodity prices — USDA AMS, USDA NASS, World Bank Pink Sheet.
- USDA NASS government reports and WASDE supplementary global forecasts.
🥈 Silver Layer — Next Phase
Cleaned, validated, and normalized data ready for cross-source integration and temporal analytics.
- Schema enforcement and validation across all sources.
- Unit normalization to metric standards.
- Crop name canonicalization (corn, soybeans).
- 16-day temporal window assignment and alignment.
- Null handling and provenance metadata tagging.
- Data quality metrics, validation reports, and checksums.
- Automated cloud processing pipelines.
🥇 Gold Layer — Engineered for AI
Cross-source aligned, ML-ready multimodal feature tables with engineered columns — ready for direct model consumption.
- 16-day temporal backbone alignment across all four modalities.
- Spatial joins keyed on regional identifiers.
- Crop-type conditional joins (corn track vs. soybean track).
- Leakage-safe feature table with enforced cutoff windows.
- 108-feature Sentinel-2 columns per row.
- Model training inputs, managed feature store, and analytics-ready data cubes.
Section 7 of 8 · Feature Engineering
108 Features Per Sentinel-2 Row
Every Sentinel-2 observation delivers 108 feature columns for model training — spanning 7 spectral bands (B02 Blue, B03 Green, B04 Red, B05 Red Edge, B08 NIR, B8A Narrow NIR, B11 SWIR), 3 vegetation indices (NDVI, EVI, SAVI), and 10 statistical aggregations per field (mean · stddev · min · p10 · p25 · p50 · p75 · p90 · p99 · max). This is not raw imagery — it is a structured feature surface ready for gradient-boosted models, RNNs, and transformer architectures alike.
Section 8 of 8 · Bronze-Layer Inventory
TerraYield by the Numbers: Exploring the Complete Dataset
The figures below reflect the completely audited inventory of the TerraYield repository. This highlights the true scale of the full Sentinel-2 agricultural dataset, spanning all multimodal formats.
|
137,211
Total Objects
|
89.091 GiB
(95.66 GB) Storage
|
4
Data Sources
|
12
Years Coverage
|
AWS S3, AES-256 encrypted • Satellite · Weather · Commodity · Government • 2015–2026, corn & soybeans
Complete File Format Breakdown
It is important to note that the 136,650 TIF files represent individual image layers. Because the pipeline generates 6 distinct files per geographical patch (raw RGB, masked, reprojected, NDVI, EVI, and SAVI), this equates to exactly 22,775 unique regional patches.
| Format | Count | Storage (GiB) | Contents |
|---|---|---|---|
| TIF | 136,650 | 88.315 | Sentinel-2 satellite imagery layers (yielding 22,775 patches) |
| JSON | 346 | 0.757 | Scene metadata and raw records |
| Parquet | 64 | 0.014 | Processed tabular statistics |
| CSV | 144 | 0.001 | USDA NASS government reports, raw |
| XLSX | 4 | 0.003 | World Bank Pink Sheet commodity price data |
| PDF & MD | 3 | ~0.001 | Project documentation and schemas |
Regional Coverage of the Sentinel-2 Agricultural Dataset
| Region | Objects | Storage | Sources |
|---|---|---|---|
| US-Iowa | 71,592 | 46.497 GiB | Sentinel-2 · Weather · Commodity · Gov |
| US-Illinois | 65,574 | 42.586 GiB | Sentinel-2 · Weather · Commodity · Gov |
| Global | 45 | < 0.01 GiB | World Bank Pink Sheet · USDA WASDE |
🌿 Explore TerraYield
TerraYield is an Omdena Innovation Challenge dataset built by a global community of AI engineers, remote sensing specialists, and agricultural scientists. Explore the full datasets catalog at datasets.omdena.com.