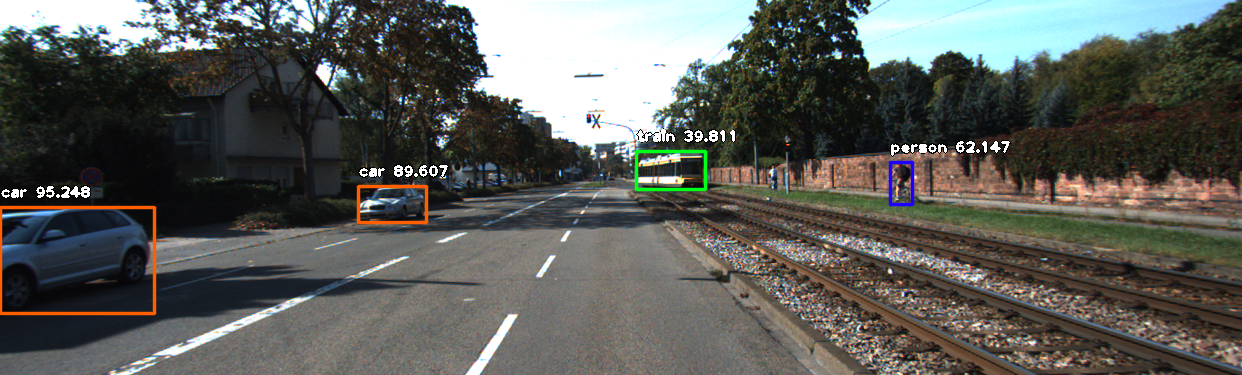
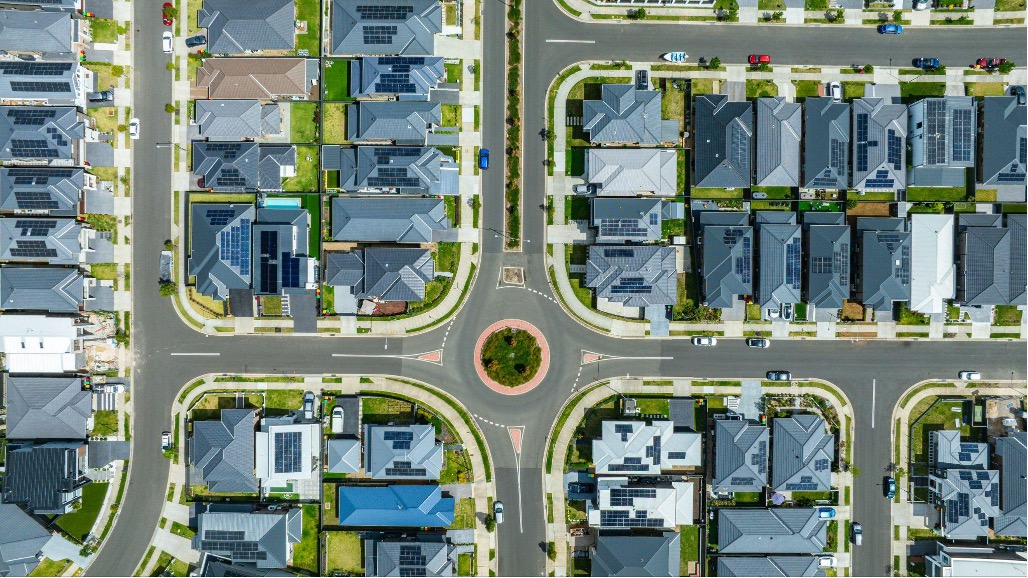
Many industries are facing formidable challenges posed by the growing severity of climate change, necessitating the need for reliability and sustainability. However, conventional or manual methods for establishing new industries often lead to delays. Fortunately, open-source satellite images present a practical solution for rapidly scaling up industrial establishments. By utilizing computer vision to analyze factors such as land use, land cover, and slope, we can efficiently identify optimal locations for installing renewable energy infrastructure.
Problem statement
The objective of the project was to collect satellite imagery for Germany, specifically Hamburg and its surrounding areas, to gather data on the availability of natural resources such as sunlight and other forms of renewable energy. By utilizing deep learning for computer vision, potential areas for resource utilization were identified. The collected data was used to estimate the maximum possible yearly production, the investment required to achieve this potential, and the impact on achieving a Net-Zero economy. Finally, a map based visualization for the complete analysis was created.
Data collection
Data was collected from the Landsat 8 Surface Reflectance Level 2 Product available on Google Earth Engine with a spatial resolution of 30m for March 2020. The European Space Agency Land use and Landcover product, which has a spatial resolution of 10m, provided information on Tree Cover, Shrubland, Grassland, Cropland, Built-up areas, Bare Vegetation, Snow and Ice, Water Bodies, Herbaceous Wetland, Mangroves, Mosses, and Lichens. Additionally, the Digital Elevation Model provided elevation data for the area.
Methods and workflow
The establishment of temperature provided a crucial tool as it measured the radiative skin temperature of the land surface. This measurement was achieved through the use of thermal bands from Landsat 8. The temperature criterion indicated the variation and distribution of temperature, which was a vital factor in identifying potential zones for a solar power plant.
Adaptation of the DN, or digital number, to the spectral radiance (L) was carried out with Equation:
CVR1 = GAIN∗DN+BIAS
• CVR1 is the cell value as radiance• DN is the cell value digital number• UCC is the unit conversion coefficient
For Landsat 8 it is given as:
LST = (0.00341802*B10)+149.0-273.15
Land surface albedo was widely used as a controlling factor of the Earth’s energy budget by regulating the amount of solar radiation reflected by the surface. Albedo was measured:
The slope-map gradient determined the predisposition of water infiltration into the earth’s crust. Areas with a vertical slope had a higher concentration of water infiltration and descending water flow, whereas flat or plain zones had additional water infiltration rates from rainwater and were influenced by temperature variation. The slope was extracted from HYDROSHEDS DEM (90m).
Suitable site selection of solar panel extraction
For Extraction of Suitable Solar Panel Multi Criteria Analysis was done
LST > LSTmean
Albedo >Albedomean
1< Degree of Slope < 5
Land Use and Land Cover must be Barren Land
Then the Initial Proposal of Solar Region was made.
Fig 1. Overall Workflow or Methodology
Results and conclusion
Barren land was a crucial factor in selecting the appropriate location for a solar panel due to its higher temperature. The final proposal for the solar region was designed to ensure that industrial and recreational sites were located far away from the solar panel site, while also maintaining a high proximity.
However, there were difficulties. For instance, there were images per year without cloud or 50% cloud (Only March and June Images were cloudless.) Additionally, it was difficult to find field-specific data for the construction site.
Fig 2. Initial Proposed Solar Panel Region.
Where Green represents Suitable Solar Panel Region
Fig 3. Final Proposed Solar Panel Region Indicating Green Colour
References
Jain, A.; Mehta, R.; Mittal, S.K. Modeling Impact of Solar Radiation on Site Selection for Solar PV Power Plants in India. Int. J.Green Energy 2011, 8, 486–498.
Jennings, N.R.; Kayadibi, O.; Pellikka, P.K.E.; Lötjönen, M.; Siljander, M.; Lens, L.; Meer, M.S.; Mishra, A.K.; Choudhury, D.;Das, K.; et al. On the Relationship between the Sky View Factor and the Land Surface Temperature Derived by Landsat-8 Images in Bari, Italy. Model. Earth Syst. Environ. 2016, 2, 4820–4835.