
Feature Analysis and Machine Learning for Road Safety
Feature analysis is an important step to develop a meaningful dataset to a machine learning model, in our case a road safety features analysis.

March 23, 2021
8 minutes read

As a part of Omdena’s project with iRap, a vital step was to undertake a feature analysis to determine which of iRap´s 66 road features have the most impact on road safety. Team team used various statistical methods and regression models to determine feature importance.
The main focus of the challenge was to develop methods that could assist iRap in identifying unsafe and dangerous roads and thus help prevent traffic accidents and injuries. As part of their focus on identifying unsafe roads, iRap uses a star rating system where the most dangerous roads receive a “one-star” rating and the safest roads receive a “five-star” rating. In addition to assigning these star ratings for users of roads who drive cars, iRap also assigns the star ratings for three other types of road users: Motorbike riders, Pedestrians, and Cyclists.
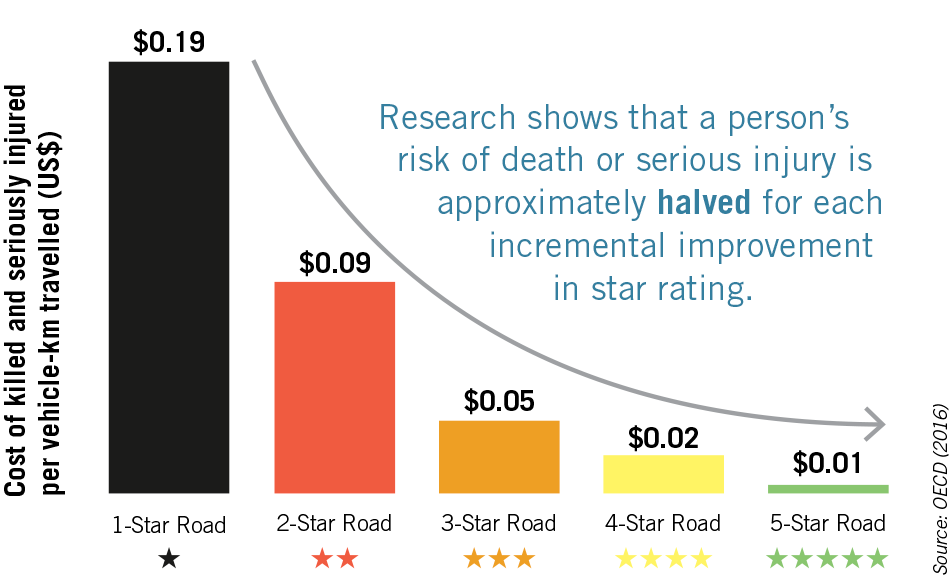
Star rating of roads graph – Source: OECD
Reasons for feature analysis
To calculate the star rating, a number of different road attributes are fed into a formula which then produces a star rating for each of the four different types of road user. As part of the project would be to develop machine learning models to predict the four types of star rating when given a set of road attributes as input, it was felt that it would be a good idea to undertake a feature analysis process to determine which of the 66 road features iRap is currently using, has the most impact on each type of star rating.
Methodology
Overview of the different feature analysis methods used
Initially, two statistical methods were used to identify the order of road features based on impact for each type of star rating. As the project progressed and the machine learning models were developed, it became apparent that there were three types of regression models that gave the best performance when predicting the star rating of a road and these was: Random Forest regressor, Extreme Gradient Boost (XGBoost) regressor and Categorical Boost (Catboost) regressor. Once these three models had been trained for each type of star rating/road user, it was possible to extract the most important input parameters (road attributes) from each model.
How the methods were used together
Thus, for each type of star rating – cars, motorcycles, pedestrians, and bicyclists – we have two statistical methods and three regression machine learning models, which give the importance of all the road features. These five different feature analysis methods were then combined to give an overall ranking of road features for each type of star rating and also when considering all four types of star rating at the same time.
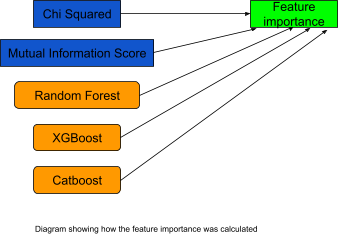
Diagram to show how feature importance was calculated – Source: Omdena
Statistical methods used in feature analysis
Firstly, we will explore the methodology behind the two statistical methods. We decided that the best statistical techniques to identify the most important features were Chi-Squared analysis and Mutual Information Score, both of which can identify the most important features with respect to each type of star rating.
Encoding type chosen
As iRap uses a large number of categorical variables for various road features, it is not such a simple matter as to simply apply the statistical methods on the input road features as this would give inaccurate results. Firstly it is necessary to perform one hot encoding on all of the categorical input values. Once the one-hot encoding has been applied to all of the input road features then for each of the one-hot encoded variables a Chi-Squared Value and Mutual Information Score can be calculated.
Applying the statistical methods to the road features
Next, the one-hot encoded variables are grouped according to the original input feature and then an average is taken to give a representative Chi-Squared Value and Mutual Information Score for each input categorical road feature. For example, if you have the input ‘curvature’ which can take the values of 1,2,3, and 4, one-hot encoding is applied to transform the curvature column into 4 columns: curvature=1,curvature=2, curvature=3 and curvature=4. Then the chi-squared values and mutual information scores are calculated for each one-hot encoded column and these are then averaged back together to give representative scores for curvature with respect to a specific star rating.
Statistical methods results
This process is applied to all categorical input variables at once and then the results are ordered with scores in descending order. The features at the top of the list have the most impact on a certain type of star rating. Now, this process is repeated for the four different types of road user/star rating and so we finally obtain 8 ordered lists for feature importance (Chi-squared ranking and mutual information score ranking for the star rating of cars, motorcycles, pedestrians, and bicycles).
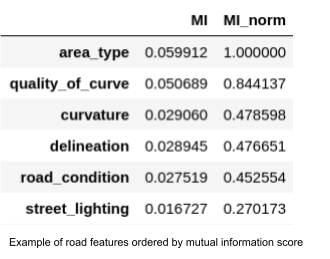
Example of road features ordered by mutual information score – Source: Omdena
Machine Learning Methods
Choosing the best ML models
Next, we move onto the methodology for the three machine learning methods. Once the star ratings sample data had been cleaned and preprocessed, it could then be fed into various different machine learning models. The first step was to use an Auto-ML-based package to see which regression models gave the best predictions for star rating for each of the four different types of star ratings.
Finding the best performing regression models
We saw that consistently there were three models which seemed to give the best performance (Random forest, XGBoost, Catboost) and so these three models were implemented in Sk-learn and further optimized by tuning the model hyperparameters and then finally using ensemble methods to combine the three different models to give further increases in the accuracy. At this stage, we are only interested in the individual models rather than the ensemble model created later as we are looking primarily at feature importance.
Obtaining the most important features
For each of the machine learning regression methods (Random forest, XGBoost, Catboost), once the model has been trained on the training data, it is possible that we can extract from the model the input features which are having the most significant impact on the target of the regression models (i.e the different types of star rating). E.g for the Sk-learn random forest regressor, once the model has been trained we can call the function “feature_importances_” from the model and obtain a list of input features ordered by importance.
Thus for each of the four types of star rating, we obtain three different trained models and each trained model gives us a list of the most important features.
Results
Now we have completed both the statistical and machine learning methods for ranking feature importance and for each type of star rating (car, motorcycle, pedestrian, and bicycle) we have five different lists which rank feature importance. Next, it is desired to combine the lists in some fashion, to give an overall feature ranking for each type of star rating. To accomplish this a points system was used as it provides a simple method to combine the lists even though each list is ranked on a different metric.
Assigning point values to road features
We take the top 30 most important features from each list and give them an arbitrary points value depending on where the road feature is ranked within the list (with the most important features receiving 30 points and the least important top 30 feature only given a single point). For each list, we then set the road features as the index within a data frame and take the associated points values. For each star rating, the five data frames are merged on the index values which correspond to certain road features, and the points are summed as the five lists are merged.
Combining points values
Finally, we then have a single list of features and point values for each type of star rating, where higher point scores signify higher feature importance across a greater number of lists. The four lists for feature importance are then used again to merge the features and sum the points to obtain a fifth list which gives the road feature importance when considering all four types of road users at the same time. The five lists are then reordered by points value in descending order to give the road features in importance order when predicting star ratings (road safety) for cars, motorcycles, pedestrians, and bicycles and additionally when considering star ratings for all four types of road users.
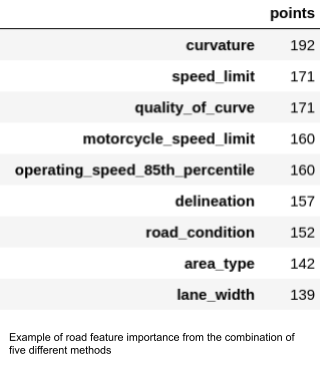
Example of road feature importance from the combination of five different methods – Source: Omdena
Now that the road feature importances are known, this allowed the other teams within the project to focus their efforts by developing machine learning models to extract certain road features from aerial images or ground-level street view data that will give the biggest increases in star rating predictive power.
Conclusion
To conclude, by finding the road features which have the biggest impact on the different types of star rating, efforts can be focused to develop machine learning methods to automatically extract these road features and these features can then be fed into the star ratings prediction models. Thus the most accurate star rating predictions can be obtained within the project time-frame by working in this efficient and directed manner.
This article is written by Leon Hamnett.
Other methodologies used through this challenge


