Internet Safety for Children: Using NLP to Predict the Risk Level of Online Games, Websites, and Applications
November 20, 2020

The Problem
Save the Children is a humanitarian organization that aims to improve the lives of children across the globe. In line with the United Nations’ Sustainable Goal 16.2 to “end abuse, exploitation, trafficking, and all forms of violence and torture against children,” Save the Children and Omdena collaborated to use artificial intelligence to identify and prevent online internet violence against children for their safety. Utilizing numerous data sources and a combination of various artificial intelligence techniques, such as natural language processing (NLP), this project’s collaborators aimed to produce meaningful insights into and prevent online internet violence against children for their safety. One area of concern is online games, websites, and applications that are popular with children, and a number of collaborators targeted this space in hopes of guarding children against online predators in the future.
What We Did
The Common Sense Media website provides expert advice, useful tools, and objective ratings for countless movies, television shows, games, websites, and applications to help parents make informed decisions about which content they want their children to consume. Particularly useful for this project, parents, and children can review games, applications, and websites on the Common Sense Media site. A number of Omdena collaborators had the idea to build web scrapers to collect parent and child reviews of the games, applications, and websites that are popular with children and use natural language processing to identify which platforms are high risk for online internet violence against children for their safety.
The first step was to scrape Common Sense Media to collect game, application, and website reviews from both parents and children. To do so, we used ParseHub software to build web scrapers to collect reviews from this website. ParseHub is a powerful, user-friendly tool that allows one to easily extract data from websites. Using ParseHub, we set three different configurations to scrap parent and child reviews of all games, applications, and websites from the internet that Common Sense Media has determined to be popular among children for their safety.
The resulting dataset includes the following features:
- 40,433 observations (reviews) from 995 different games/apps/websites
- Platform type (game, application, website)
- The risk level for online (sexual) violence against children
- Indicators for each platform’s content related to positive messages, positive role models/representations, ease of play, violence, sex, language, and consumerism. Common Sense Media provides objective ratings (from a scale of 0–5) for these indicators for the digital content included on the site. We focused on the sex indicator and re-labeled it as CSAM (child sexual abuse material). We determined a platform to be high risk for CSAM if its sex rating was greater than 2 and assigned a platform a low-risk CSAM label if its sex rating was lower than 2.
Figure 1 plots the top 20 platforms in terms of the number of reviews.
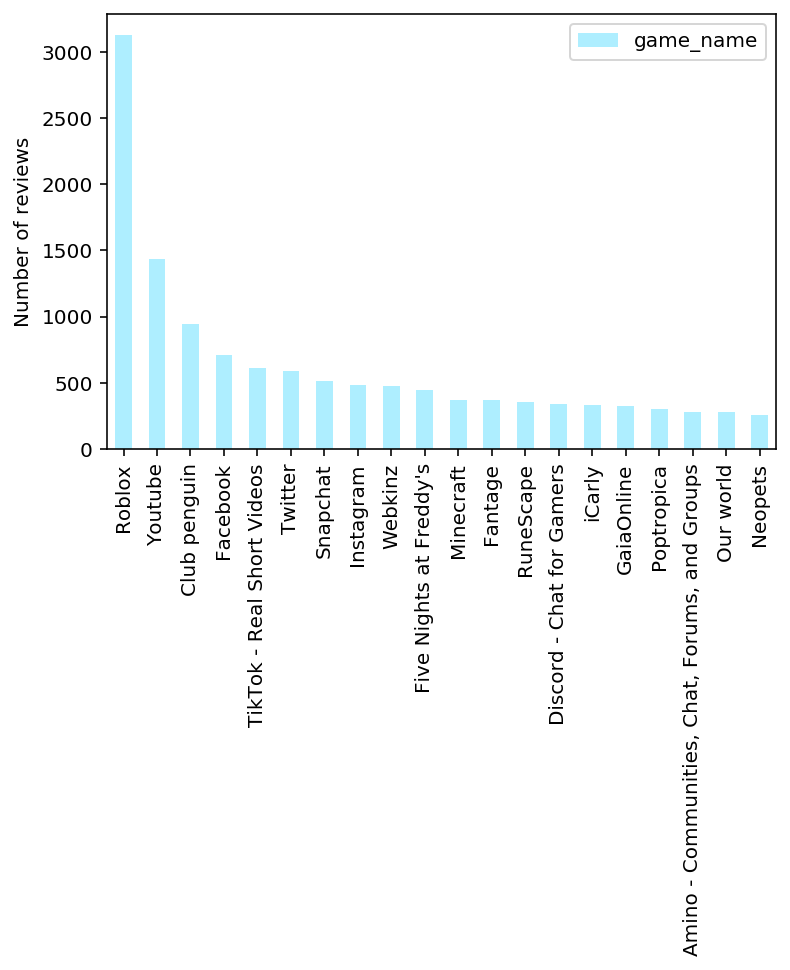
Figure 1. 20 Most Popular Platforms by Number of Reviews / Source: Omdena
Figure 2 displays the number of reviews for high and low-risk games, applications, and websites. As illustrated in the figure, there are nearly 25,000 reviews for low-risk platforms, whereas there are close to 16,000 reviews for high-risk platforms.

Figure 2. Number of Reviews by CSAM Risk Level / Source: Omdena
Data Sampling
We randomly sampled 50% of the data in order to process the data in a more efficient way. The following graphic illustrates the code used to sample 50% of the data.

Data Cleaning
It is necessary to clean the data in order to build a successful NLP model. To clean the review messages, we created a function called “clean_text” and used it to perform several transformations, including the following:
- Converted the review text into all lower-case letters
- Tokenizing the review text (i.e., splitting the text into words) and removing punctuation marks
- Removing numbers and stopwords (e.g., a, an, the, this).
- Using the WordNet lexical database to assign Part-Of-Speech (POS) tags. The POS tags are used to attach labels to words that correspond to a noun, verb, etc.
- Lemmatizing and transforming the words to their roots (i.e., games→ game, Played→ play)
Figure 3 provides an example of the reviews pre-and post-cleaning. In the “review” column, the text has not been cleaned, while the “review_clean” column includes text that has been lemmatized, tagged for POS, tokenized, etc.

Figure 3. Sample of Cleaned Text / Source: Omdena
Feature Engineering
Before applying the models, we performed some feature engineering, including sentiment analysis, vector extraction, and TF-IDF.
Sentiment Analysis
The first feature engineering step was conducting sentiment analysis. The sentiment analysis was performed on the features to gain insight into how parents and children feel about hundreds of games, applications, and internet websites that are popular with children for their safety. We used Vader, which is part of the NLTK module, for the sentiment analysis. Vader uses a lexicon of words to identify positive or negative sentiments in long sentences. It also takes into account the context of the sentences to determine the sentiment scores. For each text, Vader returns the following four values:
- Negative count score
- Positive count score
- Neutral count score
- The compound — an overall score that summarizes the previous scores
Figure 4 displays a sample of cleaned reviews containing negative, neutral, positive, and compound scores.

Figure 4. Sample of Sentiment Analysis Scores / Source: Omdena
Extracting Vectors
In the next step, we extracted vector representations for every review. Using the module Gensim, we were able to create a numerical vector representation for every word in the corpus using the contexts in which they appear (Word2Vec). This is performed using shallow neural networks. Extracting vectors in this way is interesting and informative because similar words will have similar representation vectors.
All text can also be transformed into numerical vectors using word vectors (Doc2Vec). We can use these vectors as training features because the same texts will also have similar representations.
It was first necessary to train a Doc2Vec model by feeding in our text data. By applying this model to the review text, we are able to obtain the representation vectors. Finally, we added the TF-IDF (Term Frequency — Inverse Document Frequency) values for every word and every document.
But why not simply count the number of times each word appears in every document? The problem with this approach is that it does not take into account the relative importance of the words in the text. For instance, a word that appears in nearly every review would not likely bring useful information for analysis. In contrast, rare words may be much more meaningful. The TF-IDF metric solves this problem:
TF-IDF
The Term Frequency (TF) computes the classic number of times the word appears in the text, while the Inverse Document Frequency (IDF) computes the relative importance of the word depending on the number of texts (reviews) in which the specific word is found. We added TF-IDF columns for every word that appeared in at least 10 different texts. This step allowed us to filter a number of words and, subsequently, reduce the size of the final output. Figure 5 provides the code used to apply TF-IDF and assign the resulting columns to the data frame, and Figure 6 displays the output of the sample code.

Figure 5. TF-IDF Code Sample / Source: Omdena

Figure 6. TF-IDF Sample Code Output / Source: Omdena
Exploratory Data Analysis
The EDA produced a number of interesting insights. Figure 7 provides a sample of reviews that received high negative sentiment scores, and Figure 8 displays a sample of reviews with high positive sentiment scores. The sentiment analysis successfully assigned negative sentiments to reviews with text such as “violence, horror, dead.” The analysis also effectively assigned positive sentiments to reviews containing words such as “fun, cute, exciting.”
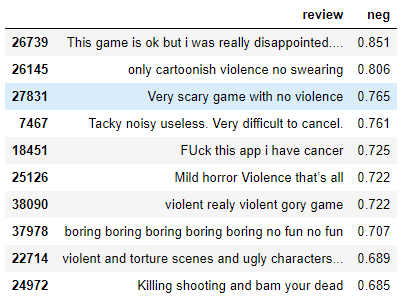
Figure 7. Sample of Reviews with High Negative Scores / Source: Omdena
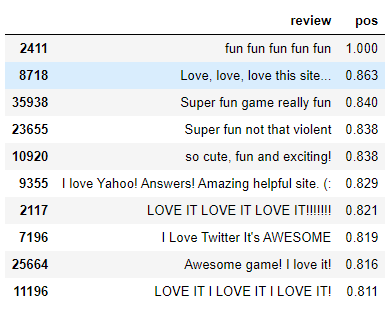
Figure 8. Sample of Reviews with High Positive Scores / Source: Omdena
Figure 9 shows the distribution of the trend of messages among high and low-risk games. Varder categorizes low-risk reviews as positive messages, whereas high-risk reviews should have lower compound sentiments. This shows that the sentiment feature extractions proved helpful in modeling the risk analysis.
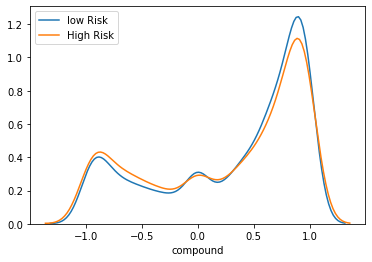
Figure 9. High_Low Risk Distribution over Compound Sentiments / Source: Omdena
Modeling High-Risk Games/Applications/Websites
After we successfully scraped the reviews, built the dataset, cleaned the data, and performed feature engineering, we were able to build an NLP model. We choose which features (reviews and clean reviews) to use to train our model.
Then, we split our data into two parts:
- Training set for training purposes
- The test set to assess the model performance
After selecting the features and splitting the data into test/training sets, we fit a Random Forest classification model and used the reviews to predict whether a platform is a high risk for CSAM. Figure 10 displays the code used to fit the Random Forest classifier and obtain the metrics.
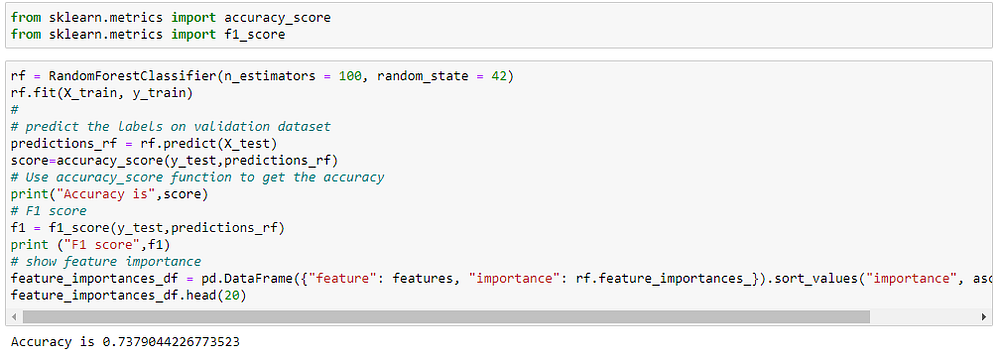
Figure 10. Random Forest Classifier Code Sample / Source: Omdena
Figure 11 displays a sample of features and their respective importance. The most important features are indeed the ones that were obtained in the sentiment analysis. In addition, the vector representations of the texts were also important in our training. A number of words appear to be fairly important as well.
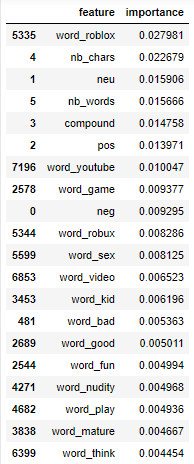
Figure 11. Feature Importance / Source: Omdena
The Receiver Operating Characteristic Example (ROC) curve and Area Under the Curve (AUC) allow one to evaluate how well a model performs in terms of its ability to distinguish between classes (high/low risk for CSAM in this context). The ROC curve, which plots the true positive rate against the false-positive rate, is displayed in Figure 12. The AUC is 0.77, which indicates that the classifier performed at an acceptable level.
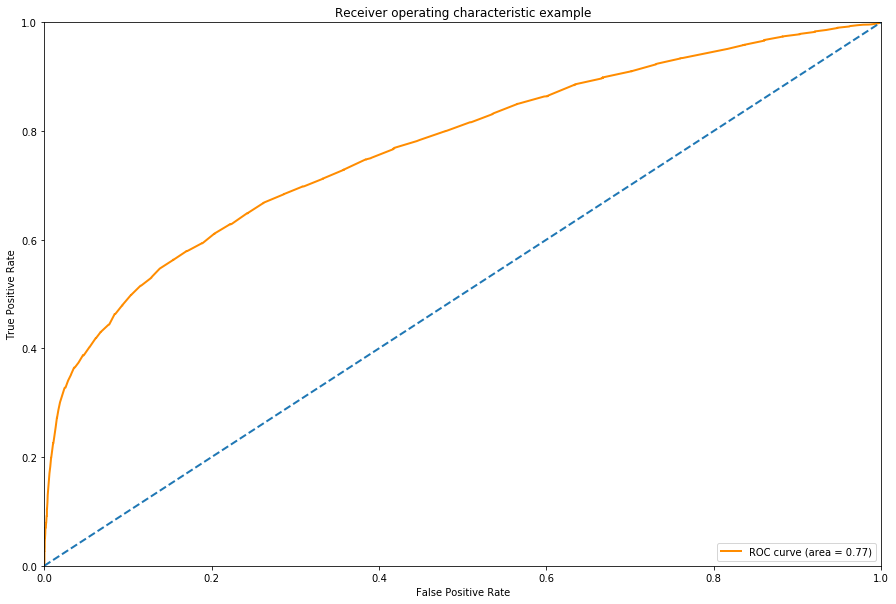
Figure 12. ROC Curve / Source: Omdena
The Precision-Recall (PR) Curve is illustrated in Figure 13. The PR curve is graphed by simply plotting the recall score (x-axis) against the precision score (y-axis). Ideally, we would achieve both a high recall score and a high precision score; however, there is often a trade-off between the two in machine learning. The sci-kit learn documentation states that the Average Precision (AP) “summarizes a precision-recall curve as the weighted mean of precisions achieved at each threshold, with the increase in recall from the previous threshold used as the weight.” The AP here is 0.72, which is an acceptable score.

Figure 13. Precision-Recall Curve / Source: Omdena
It is evident in Figure 13 that the precision decreases as we increase the recall. This indicates that we have to choose a prediction threshold based on our specific needs. For instance, if the end goal is to have a high recall, we should set a low prediction threshold that will allow us to detect most of the observations of the positive class, though the precision will be low. On the contrary, if we want to be really confident about our predictions and are not set on identifying all the positive observations, we should set a high threshold that will allow us to obtain high precision and a low recall.
In order to determine whether or not the model we built performs better than another classifier, we can simply use the AP metric. To assess the quality of our model, we can compare it to a simple decision baseline. With a random classifier for the baseline, the model would simply assign 0 half the time and 1 the other half of the time. Our AP metric is 0.77, which is better than a random classifier.
Conclusion and Observations
It is nearly possible to use just raw text as input to make predictions. The most important aspect is to be able to extract the relevant features from a raw data source. Such data can often complement data science projects, allowing one to extract more meaningful/useful features and increase the model’s predictive power.
We were only able to predict the platform’s risk through user reviews, and it is possible that the reviews are biased. To improve the precision of our predictive model, we can triangulate other features such as player sentiments, game titles, UX/UI features, and in-game chats. Used in combination, these features can provide a number of insightful recommendations. Our predictive model will shed light on CSAM risk in online games, applications, and websites that are popular with children by automatically detecting each platform’s risk level. In the future, we hope that parents will be able to better select platforms for their child’s use based on our use of AI.
—
Written by Sabrina Carlson and co-authored by Erum Afzal. Contributors include Anna Kolbasko, Juber Rahman, Erum Afzal, Mateus Broilo, Rahul Gopan, Rubens Carvalho, Vinod Rangayyan, Adele C, and Rosana de Oliveira Gomes.
Related Articles


