This project shows how drone imagery and computer vision can reliably separate crops from weeds at field scale, making site specific herbicide application practical in real farming conditions. By combining synthetic data generation, superresolution, detection and segmentation models with active learning, the pipeline delivers accurate weed maps while reducing manual annotation effort. The outcome is lower chemical use, reduced costs and a scalable foundation for precision agriculture.
Introduction
Weeds compete directly with crops for nutrients, water and light, and can significantly reduce yields if left unmanaged. Traditional weed control methods often rely on blanket herbicide spraying, which increases costs and causes long-term harm to soil, water and surrounding ecosystems. Precision agriculture addresses this challenge by enabling herbicides to be applied only where weeds are present, making early and accurate weed detection a critical requirement for sustainable farming.
Recent advances in unmanned aerial vehicles (UAVs) and artificial intelligence now enable low-cost capture and analysis of high-resolution field imagery using computer vision models. This progress highlights the growing role of AI in agriculture for precision farming and automated crop monitoring.
Public datasets such as DRONEWEED have accelerated early-season weed classification research using deep-learning approaches like convolutional neural networks and vision transformers. Building on this progress, the Omdena–SkyMaps project focused on mapping weeds and crops in beetroot and corn fields using drone imagery to support targeted interventions that reduce chemical use and improve farm efficiency.
Problem Statement
Traditional weed management relies on manual scouting or uniform herbicide applications. Both are inefficient: manual surveys are slow and labour‑intensive, while spraying entire fields treats many areas with no weeds. SkyMaps and Omdena aimed to develop a system that automatically distinguishes crop plants from weeds and pinpoints their locations within drone images. The challenge combines data acquisition (obtaining enough annotated images across different resolutions) with model design (choosing architectures that handle class imbalance and small objects). Ultimately, the goal is to enable farmers to spray only where weeds grow, lowering costs and protecting soil and water quality.
Project Scope and Deliverables
The project spanned the full machine‑learning pipeline, from data preparation to deployment. Five core deliverables were defined:
These deliverables reflect how modern computer vision pipelines increasingly rely on advanced instance segmentation and semantic understanding to move from experimentation to field-ready deployment.
Data augmentation: Because collecting large numbers of labelled images is expensive, the team generated synthetic training data. Weed and crop cut‑outs were composited onto varied backgrounds, creating over 1 000 annotated images with masks and COCO annotations. The approach produced training, validation and test sets without further fieldwork.
Superresolution: To enhance low‑resolution drone images, deep‑learning models were investigated that convert low‑resolution inputs into 512 × 512‑pixel outputs. Improving image fidelity helps models recognise small weed seedlings.
Object detection: Multiple architectures—including Faster RCNN, Detectron 2, YOLOv4 and YOLOv5—were benchmarked to locate and classify individual plants. Models were trained on both real and synthetic datasets and evaluated using mean average precision (mAP) at an IoU threshold of 0.5.
Segmentation: U‑Net variants and Mask RCNN were used for pixel‑level classification of images. Semantic segmentation labels each pixel as crop or weed, while instance segmentation delineates individual plants.
Active learning and deployment: Using the OnePanel/CVAT platform, the team built an annotation workflow that combines model predictions with human corrections. An inference API was packaged and integrated into the SkyMaps platform, enabling real‑time weed mapping for end users.
Methodology
Data Collection and Augmentation
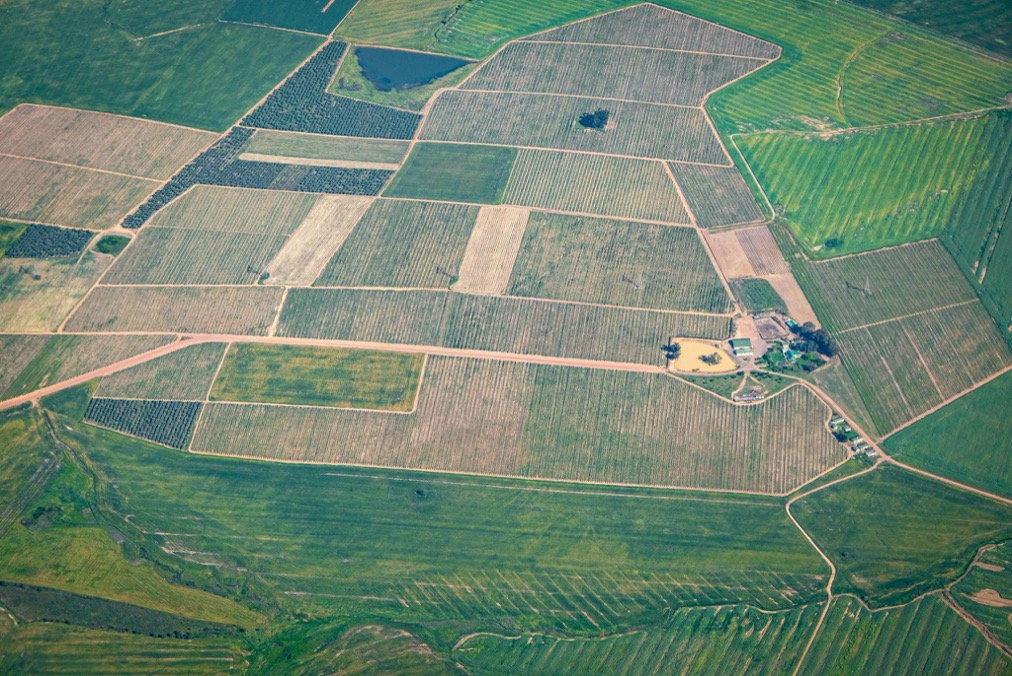
SkyMaps provided orthophoto maps captured by drones at ground sampling distances of 5–30 mm per pixel for high‑resolution flights and 10–100 mm per pixel for lower resolutions. These maps were tiled into 512 × 512 images and manually annotated to identify crops (beetroot and corn) and weeds (thistle).
Figure 1. Annotated weed samples from drone imagery. Sample images from the SkyMaps dataset illustrate how crops and weeds are labeled for training. Such examples help readers visualise the classification task and the complexity of real field conditions.
To expand the dataset, the team created a synthetic augmentation pipeline:
Dataset structure: The baseline dataset included 217 background images, 9 thistle foreground images and 51 annotated images (25 validation and 26 test). This small collection could not support robust model training.
Synthetic image generation: Collaborators used GNU Image Manipulation Program (GIMP) to cut weed and crop plants from the SkyMaps images. These foreground cut‑outs were randomly placed on background photos, and corresponding masks and COCO annotations were generated. The pipeline produced 1 000 training images, 100 validation images and 100 test images, each 512 × 512 pixels, dramatically increasing the training diversity.
Evaluation: A Faster RCNN baseline model was trained on the synthetic dataset. Although it achieved reasonable performance on synthetic validation and test sets ([email protected] ≈ 0.64 on validation and 0.66 on synthetic test images), its mAP on real test images was only 0.08, highlighting the challenge of domain transfer from synthetic to real data.
Superresolution
Low‑altitude flights yield fewer images and faster field coverage but at the cost of lower resolution. To recover high‑resolution detail, the superresolution team evaluated several models that upscale low‑resolution RGB inputs to 512 × 512 outputs.
Figure 2. Superresolution workflow. Orthophoto maps are tiled into small images, fed into various models (DCSCN, auto‑encoders, SRCNN, Pix2Pix and UNet) and evaluated using structural similarity index (SSIM) and mean squared error (MSE).
Training data comprised high‑resolution images (HR) and corresponding downscaled low‑resolution images (LR). The dataset included:
Image type
Resolution
Train
Validation
Test
High‑resolution (HR)
512 × 512
224
20
30
Low‑resolution (LR)
256 × 256
730
40
90
Low‑resolution (LR)
128 × 128
200
10
30
Several architectures were assessed using three metrics: mean squared error (MSE), peak signal‑to‑noise ratio (PSNR) and structural similarity index (SSIM). The Deep CNN with Skipped Net (DCSCN) achieved the best balance of accuracy and visual fidelity (SSIM ≈ 0.765, MSE ≈ 821, PSNR ≈ 26.5). Although auto‑encoders and generative adversarial networks (GANs) produced higher PSNR scores, they introduced discolouration and artefacts that degraded downstream detection. Consequently, the DCSCN model was selected for superresolution preprocessing.
Object Detection
The object‑detection task requires locating plant instances and classifying them into four categories: thistle, small beetroot, large beetroot and corn. Collaborators trained and evaluated several models on real and synthetic datasets.
Figure 3. Example of YOLOv5 training metrics. Losses decrease while precision, recall and mAP improve over successive epochs, illustrating model convergence.
Performance was measured using mAP at IoU ≥ 0.5. The results are summarised below:
The YOLOv5 large model offered the best balance of speed and accuracy, achieving an mAP above 70 % on the test set. Detectron 2 provided competitive performance on the validation set but was slower during inference. Experiments comparing models trained exclusively on the synthetic dataset versus the real dataset revealed the limitations of synthetic data: for example, a Detectron 2 model trained only on synthetic images achieved a mAP of 7.26 % on the real test set, compared with 49.05 % when trained on real data. These findings underscore the importance of collecting real images even when synthetic augmentation is used.
Segmentation
Segmentation was tackled at two levels: semantic and instance segmentation for weed detection, where semantic models classify each pixel as crop or weed while instance segmentation delineates individual plants. In real agricultural settings, choosing between these approaches depends on data availability, plant density and operational goals—factors that strongly influence how segmentation outputs translate into actionable weed maps. Metrics included Intersection over Union (IoU), Dice coefficient and mAP for instance segmentation. Results for U‑Net variants and Mask RCNN are summarised below:
Type
Model (backbone & resolution)
IoU (crop)
IoU (weed)
Dice (crop)
Dice (weed)
mAP (instance)
Semantic
U‑Net (896 × 896)
0.937
0.808
0.893
0.893
–
Semantic
U‑Net (EfficientNet, 768 × 768)
0.857
0.458
0.922
0.620
–
Semantic
U‑Net (512 × 512)
0.850
0.250
0.920
0.400
–
Semantic
U‑Net (MobileNet, 256 × 256)
0.563
0.055
0.486
0.043
–
Instance
Mask RCNN (ResNet101, 512 × 512)
–
–
–
–
0.590
Instance
Mask RCNN (ResNet50 + FPN, 1024 × 768)
–
–
–
–
0.396
The largest semantic U‑Net (896 × 896) delivered high IoU and Dice scores for both crop and weed classes, confirming that spatial resolution matters when delineating small weed patches. For instance segmentation, Mask RCNN with a ResNet101 backbone achieved a mAP of 0.59, outperforming the ResNet50‑based variant.
Active Learning and Deployment
After training baseline detection and segmentation models, the team employed an active‑learning loop using the OnePanel/CVAT platform:
Baseline dataset preparation: The initial labelled dataset—consisting of bounding boxes for object detection and polygons for instance segmentation—was uploaded to CVAT.
Model training: TensorFlow Object Detection and Mask RCNN models were trained using OnePanel’s built‑in data augmentation and hyperparameter tuning features.
Auto‑annotation: The trained models were linked to CVAT to automatically label new, unlabeled images. This auto‑annotation generated pseudo‑labels that served as a starting point for human annotators.
Human feedback: Annotators reviewed the pseudo‑labels and corrected errors using CVAT’s editing tools. The corrected labels were added to the training set.
Retraining: The improved training set was used to fine‑tune the models, and the cycle repeated. Each iteration reduced annotation time and improved model accuracy.
Finally, an inference API encapsulating the best models was deployed within the SkyMaps platform. Users can select crop type and view predicted weed locations on their fields in real time, enabling site‑specific spraying.
Results and Discussion
The integrated pipeline achieved promising results. Object‑detection accuracies exceeded 70 % mAP on real test images with the YOLOv5 large model, while semantic segmentation models attained high IoU and Dice scores for both crops and weeds. Data augmentation increased training diversity, and superresolution improved the clarity of low‑resolution images. However, experiments showed that synthetic data alone cannot replace real data: models trained solely on augmented images performed poorly on real test sets. Active learning proved valuable for accelerating annotation and iteratively improving model performance.
The project’s findings align with research on early‑season weed classification, which notes that high‑quality datasets enable advanced deep‑learning models and can reduce pesticide use by enabling targeted control. By combining synthetic data generation, superresolution, detection, segmentation and active learning, the Omdena–SkyMaps collaboration created a robust workflow for weed mapping.
Challenges and Solutions
Several challenges emerged during the project:
Limited annotated data: Manual labelling is expensive and time‑consuming. Solution: The team generated thousands of synthetic images and employed active learning to iteratively improve models with minimal human effort.
Low‑resolution imagery: High‑altitude flights produce coarse images. Solution: Superresolution models restored fine details, boosting detection performance.
Class imbalance: Weed instances were less common than crop instances. Solution: Oversampling through synthetic augmentation and balanced training sets helped models learn from under‑represented classes.
Model selection: Each architecture has trade‑offs in speed and accuracy. Solution: By evaluating multiple models, the team identified YOLOv5 large and Mask RCNN as the best performers for detection and instance segmentation, respectively.
Impact and Future Work
Precision weed detection has clear environmental and economic benefits. Applying herbicides only where weeds are detected reduces chemical usage, lowers costs and protects soil and water. Early weed classification allows farmers to take action when plants are most vulnerable, improving yields and supporting sustainable agriculture. The Omdena–SkyMaps project illustrates how deep learning and UAV imagery can deliver these benefits through an operational tool.
Future research could expand the dataset to include more weed species and crop types, incorporate multispectral or hyperspectral imagery to support plant health prediction using drone imagery, and develop lightweight models suitable for on-board processing.
Conclusion
The Omdena–SkyMaps project shows how computer vision and drone imagery can enable precise, scalable weed detection in real agricultural settings. By combining synthetic data augmentation, superresolution, deep-learning models, and active learning, the team built a practical pipeline that accurately distinguishes crops from weeds and integrates directly into farm workflows.
While real, high-quality data remains essential for strong performance, the results highlight the potential of AI-driven weed mapping to reduce chemical use, lower costs, and support more sustainable farming. With expanded datasets and continued model refinement, such systems can become a core component of precision agriculture.
If you’re looking to apply drone imagery and computer vision to precision weed management and reduce chemical use, Omdena helps turn AI research into practical farming solutions. Connect with Omdena to explore how this approach can scale to real-world fields.
FAQ
What is weed and crop detection using computer vision?
It is the use of AI models to automatically identify weeds and crops in drone images so farmers can take targeted action.
How do drones help in weed detection?
Drones capture high-resolution aerial images that reveal weed presence across large fields faster than manual scouting.
Why is targeted weed detection important?
It allows herbicides to be applied only where weeds exist, reducing chemical use, costs and environmental damage.
Which computer vision models are used for weed and crop detection?
Common models include YOLO for object detection and U-Net or Mask R-CNN for semantic and instance segmentation.
Can synthetic data replace real drone images for training models?
No, synthetic data helps augment training, but real annotated images are essential for reliable field performance.
How does superresolution improve weed detection accuracy?
Superresolution enhances low-resolution drone images, making small weed seedlings easier for models to detect.
What role does active learning play in this system?
Active learning reduces manual annotation effort by using model predictions that humans only need to correct.
Is this approach suitable for real-world farming operations?
Yes, the system is deployed through an inference API and integrates directly into farm platforms for real-time use.
Continue with Omdena
Share this article
Share on LinkedIn, send by email, or copy the direct link.