
How AI Maps Nitrogen Flow Across Farmland Using Satellite and Geospatial Data — Omdena Case Study
See how AI maps nitrous oxide emissions field by field across UK farmland using satellite data, improving prediction accuracy from 77% to 89%.
May 15, 2026
13 minutes read
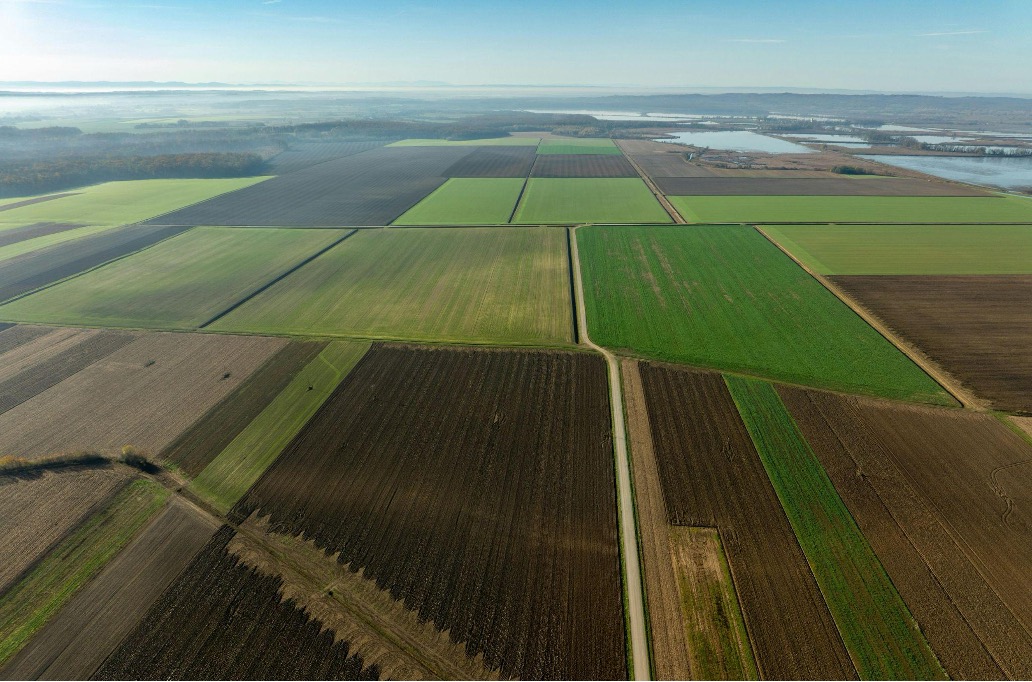
Every year, farmers spread millions of kilograms of nitrogen fertiliser across their fields. Not all of it is absorbed by the soil: some escapes into the air as nitrous oxide, a gas 270 times more damaging to the climate than CO₂. For decades, the only estimate of how much was escaping was a rough national average that could be either half or twice the actual amount. This project built an AI system that predicts emissions field by field and season by season using satellite data.
Executive Summary
This project built an AI pipeline to model and map nitrous oxide emissions across UK farmland. Rather than training purely on the limited field measurements available, the core model first learned nitrogen cycling behaviour from a well-established soil science simulator, then refined that understanding using two rounds of real UK field data. The model’s accuracy rose from explaining 77% of measured emissions after the simulation stage to 89% after learning from real field records.
The data foundation drew on six sources covering climate, soil chemistry, and land use across the UK. One result stood out clearly: N₂O emission peaks aligned almost directly with nitrogen fertiliser application dates, with a correlation of 0.7 across all monitored sites. Fertiliser timing is the most direct lever a farmer or land manager can pull to reduce field-level emissions.
Running in parallel, the team built an AI chatbot that makes the project’s findings queryable in plain language, with no technical background required. Designed with the persona of a regenerative agriculture specialist with 20 years of UK advisory experience, it answers questions about nitrogen emissions, fertiliser management, and field-level interventions by drawing on the project’s indexed knowledge base rather than general internet training.
| KEY FINDINGS | |
| Fine-tuned KGML-Ag model | achieved validation R² = 0.89 and train R² = 0.90 on N₂O flux prediction, up from validation R² = 0.77 at pre-training |
| 0.7 correlation confirmed | between nitrogen fertiliser application dates and N₂O emission peaks across all UK farm sites |
| Two-stage fine-tuning completed | First on Ecosys academic benchmark data, then on real AEDA UK ground truth, adding grass and barley to the crop coverage |
| 8 AEDA experimental groups | integrated across UK farmland: fertiliser trials, slurry studies, nitrification inhibitor experiments, and grassland assessments |
| 6 geospatial data sources fused | NASA POWER, COSMOS-UK, UKSO, HWSD, CROME, and AEDA assembled into a single 3D time-series modelling pipeline |
| Agronomist AI chatbot deployed | GPT-3.5 Turbo RAG system with a regenerative agriculture specialist persona, making findings queryable in plain language |
The Problem: A Greenhouse Gas No One Is Counting Accurately
When a farmer applies nitrogen fertiliser to a field in early spring, only a fraction is absorbed by the crop. The remainder cycles through multiple pathways: leaching as nitrate, volatilising as ammonia, or converting into nitrous oxide through microbial nitrification and denitrification. This last pathway is highly sensitive to soil moisture, temperature, organic carbon, and fertiliser application timing. Two adjacent fields managed identically on paper can produce N₂O emissions that differ by a factor of 10 or more, depending on soil moisture the week before.
Continuous N₂O monitoring requires automated gas flux chambers maintained across full growing seasons. For a research station, this is achievable; for the 9.3 million hectares of UK arable land, it is not. National greenhouse gas inventories rely instead on a single average emission factor: the IPCC default assumes 1 kg of N₂O for every 100 kg of nitrogen applied, with uncertainty ranges that can span a hundredfold from the lowest to the highest estimate. It is not a measurement; it is a placeholder.
A measurement timing problem compounds the data scarcity problem. N₂O flux peaks happen within hours of a fertiliser application or rainfall event. The AEDA ground-truth records used in this project were measured at most once a week, meaning the sharpest emission spikes were systematically missed by the instruments. This is an inherent constraint of field monitoring, and it is precisely why daily computer simulation of how nitrogen moves through soil was essential, not optional.
The consequences reach beyond accounting. Farmers trying to reduce emissions through precision fertiliser scheduling have no reliable feedback on whether their decisions are working. Policymakers pricing agricultural carbon face figures they cannot defend to international auditors. This project addressed both gaps by building a prediction system that operates field-by-field, using satellite and soil data already available across the UK at no additional cost per hectare.
Building the Data Foundation: Six Sources, One Pipeline
N₂O flux measurements are rare, expensive, and geographically concentrated near research institutions. The Agricultural and Environmental Data Archive (AEDA) covers eight UK land management categories: fertiliser trials, dung and urine experiments, emission factor determinations, slurry nitrogen loss studies, nitrification inhibitor trials, cracking clay soil experiments, slurry timing studies, and nitrogen fertiliser form assessments. Each category required careful cleaning and standardisation before it could be used for model training.
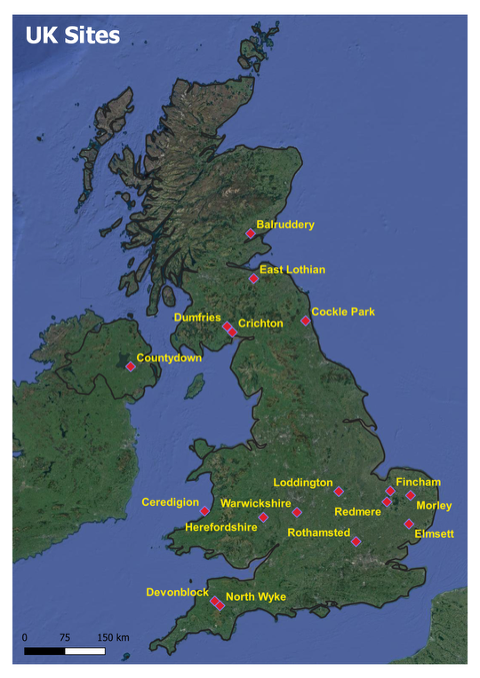
Figure 1: DNDC simulation sites distributed across the UK, from Scotland to East Anglia, capturing diverse soil types, climate regimes, and management practices across UK arable farmland.
Filling measurement gaps with DNDC required selecting it from four candidate models. Daily Century proved difficult to configure. Ecosys has an intuitive interface, but its data-entry process makes running multiple sites in parallel impractical. APSIM carries a learning curve judged unsuitable for the project timeframe. DNDC was selected for its broad scientific adoption and its ability to simulate nitrogen and carbon dynamics for any site using standard climate, soil, crop, and management inputs.
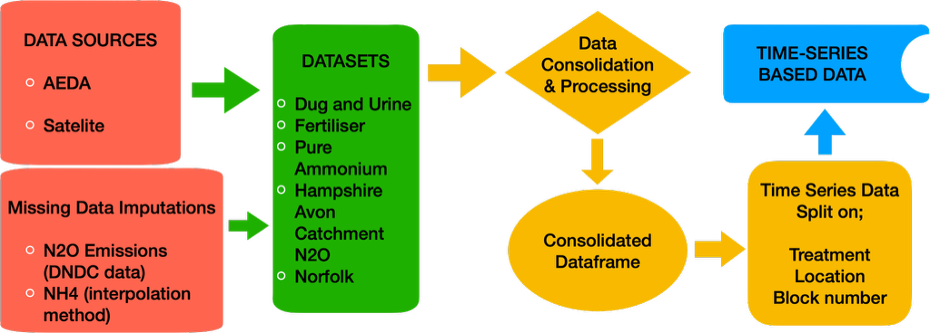
Figure 2: AEDA data processing pipeline. Raw experimental records from eight land management categories were consolidated with DNDC-generated N₂O flux for missing values, then assembled into 3D time-series arrays for model training.
Climate variables were obtained from NASA POWER: daily temperature, precipitation, wind speed, and humidity, queried using site latitude and longitude. Site-level physical constants came from COSMOS-UK stations: elevation, bulk density, annual rainfall, and land-use type.
Soil texture and chemistry came from the UK Soil Observatory and the Harmonized World Soil Database. Crop type was derived from the Crop Map of England, which classifies land into over 15 agricultural types using satellite imagery. All inputs were assembled into a single time-series dataset, with earlier growing seasons used to train the model and later seasons reserved for testing.
Simulation First, Data Second: The Case for Two-Stage Training
A standard machine learning model trained on the AEDA dataset would face an immediate problem: the data is sparse, geographically concentrated, and does not cover the full range of soil types, climate conditions, and management practices across UK farmland. A model that has only seen what has been measured will fail silently outside those boundaries. KGML-Ag addresses this by reversing the usual order: it learns the science of nitrogen cycling before it learns from data.
Three Model Designs Compared
The team implemented three KGML-Ag variants. The Stacked-GRU processes all inputs through two sequential GRU modules and a dense output layer. KGML-ag1 separates the task into two modules: one predicts intermediate biochemical variables (CO₂, NO₃, NH₄+, soil water content), and a second uses those to predict N₂O flux, mirroring the actual biochemical pathway.
KGML-ag1 adapted preserves this modular structure but operates without full intermediate-variable data, which could not be sourced at UK-wide spatial and temporal resolution. This adapted variant was selected for final training. All three architectures use z-normalisation and 365-day fixed-length time series, with leap years handled by removing 31 December.
Step One: Learning from Simulated Data
Pre-training exposed KGML-Ag to DNDC-generated N₂O flux data spanning a wide range of UK farm conditions, including soil types, climate regimes, fertiliser scenarios, and tillage practices, across wheat and corn sites. Through this stage, the model learned how N₂O responds to fertiliser events, how soil moisture modulates emissions after rainfall, and how temperature drives microbial activity. Pre-training results: training R² of 0.83, validation R² of 0.77, training RMSE of 0.0048 kg N₂O ha⁻¹, and validation RMSE of 0.0055 kg N₂O ha⁻¹.
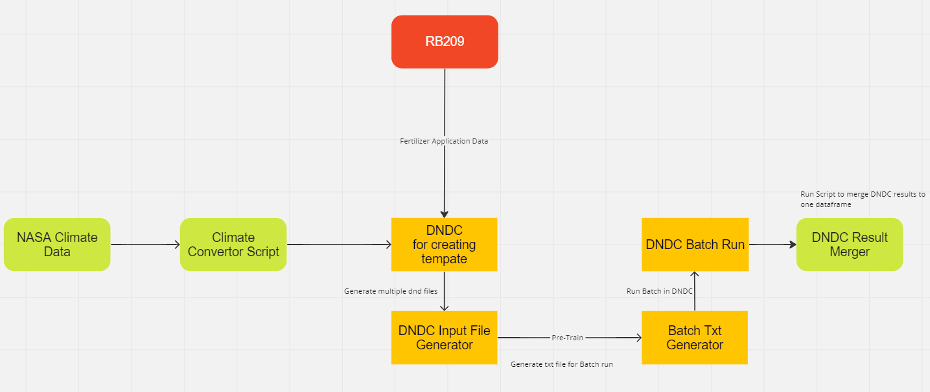
Figure 3: DNDC synthetic data generation workflow. NASA POWER climate inputs and RB209 fertiliser schedules were converted into DNDC site input files, run in batch mode across all UK simulation sites, and merged into a single pre-training dataset for KGML-Ag.
Fine-Tuning: From Academic Benchmark to Real Field Measurements
Fine-tuning proceeded in two stages, shaped by practical timing. AEDA data was still being processed when model development began, so the team first fine-tuned on Ecosys benchmark data from the original KGML-Ag academic paper. This required careful unit reconciliation: wind speed was documented as m s⁻¹ but confirmed by the paper’s authors as km d⁻¹; NH₄ units used a mass-to-mass ratio incompatible with the model’s expected format and were dropped; humidity values did not match any standard definition and were excluded.
The second stage fine-tuned on real AEDA ground truth, introducing grass and barley as crop types absent from pre-training. After fine-tuning, the model achieved a training R² of 0.90 and a validation R² of 0.89, with a validation RMSE of 0.008 kg N₂O ha⁻¹.
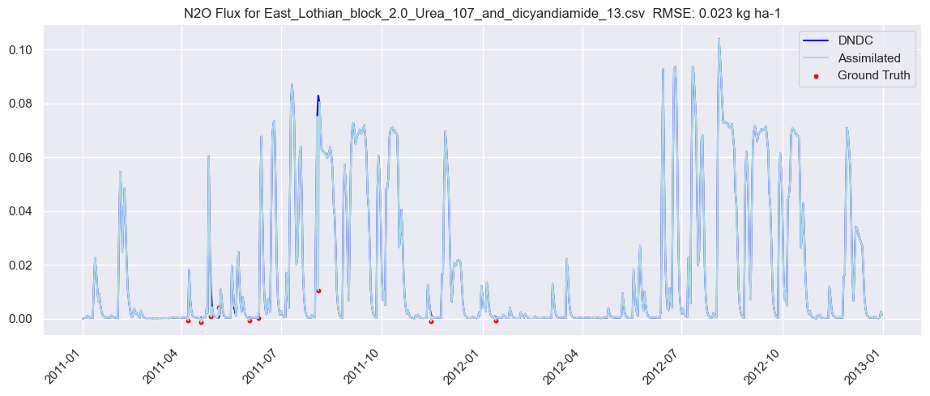
Figure 4: KGML-Ag model output for East Lothian (urea and dicyandiamide treatment, 2011–2013). Dark blue: DNDC pre-training baseline. Light blue: fine-tuned assimilated model. Red dots: sparse AEDA ground truth measurements. Validation RMSE: 0.023 kg ha⁻¹.
Agronomist AI: Making the Findings Accessible
Rather than a generic assistant, the team built a specific persona: Agronomist AI, a specialist with 20 years of regenerative agriculture experience advising UK farmers on reducing synthetic nitrogen use. Built on GPT-3.5 Turbo with ADA-002 embeddings in a Chromadb vector database, it uses 1,024-character document chunks with 128-character overlap. The prompt requires British English spelling, source document citations with page numbers, and answers drawn from the indexed project knowledge base rather than general model knowledge.
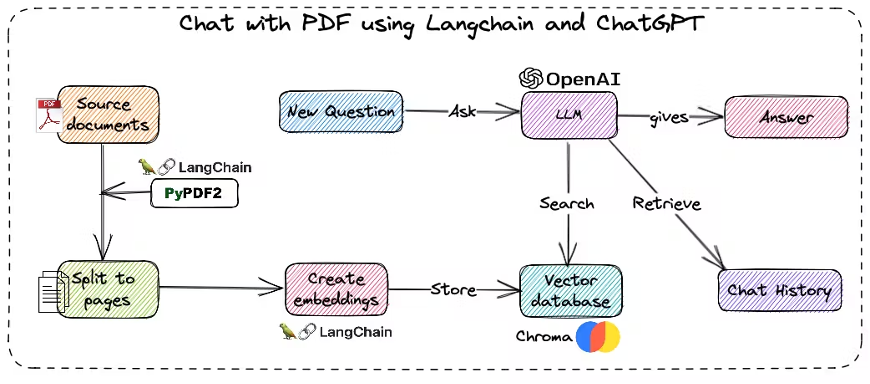
Figure 5: Agronomist AI chatbot architecture. Project documentation was split into chunks, embedded via ADA-002, and stored in Chromadb. GPT-3.5 Turbo retrieves user queries to answer using a specialist regenerative agriculture persona.
What the Model Found: Results and Honest Limitations
The most striking result from the DNDC exploratory analysis was a correlation rather than a model metric. Across all UK farm sites in the 2015 time series, the relationship between nitrogen fertiliser application dates and N₂O emission peaks was 0.7, a strong signal in a system where dozens of variables interact simultaneously. N₂O peaks aligned with the exact calendar dates of fertiliser application events.
Secondary peaks corresponded to days of excessive rainfall, where waterlogging creates anaerobic conditions that trigger denitrification even without fresh fertiliser. At Elmsett, one simulation site examined individually, precipitation-driven peaks accounted for the majority of N₂O spikes not linked to fertiliser events.
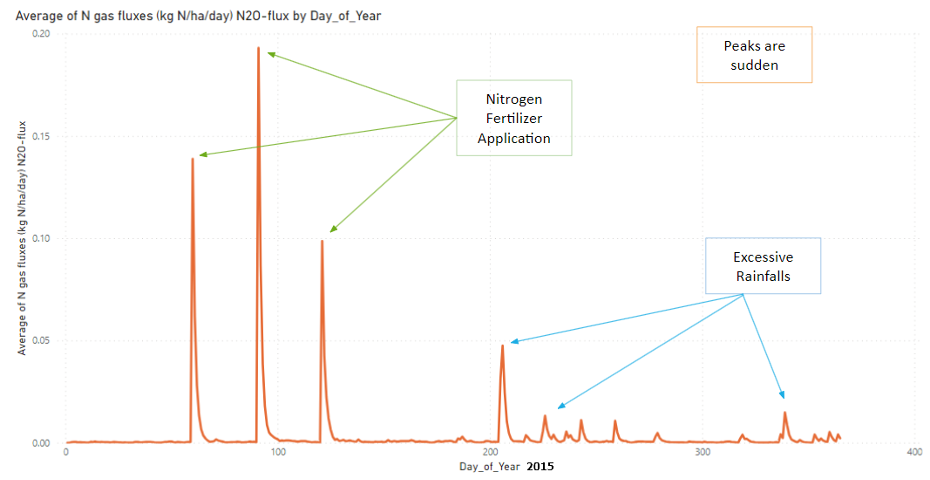
Figure 6: Average N₂O flux across all UK farm sites in 2015 (DNDC output). The three large spikes correspond to nitrogen fertiliser application events (annotated in green); smaller peaks align with days of excessive rainfall (annotated in blue), confirming the two dominant drivers of field-level N₂O emissions.
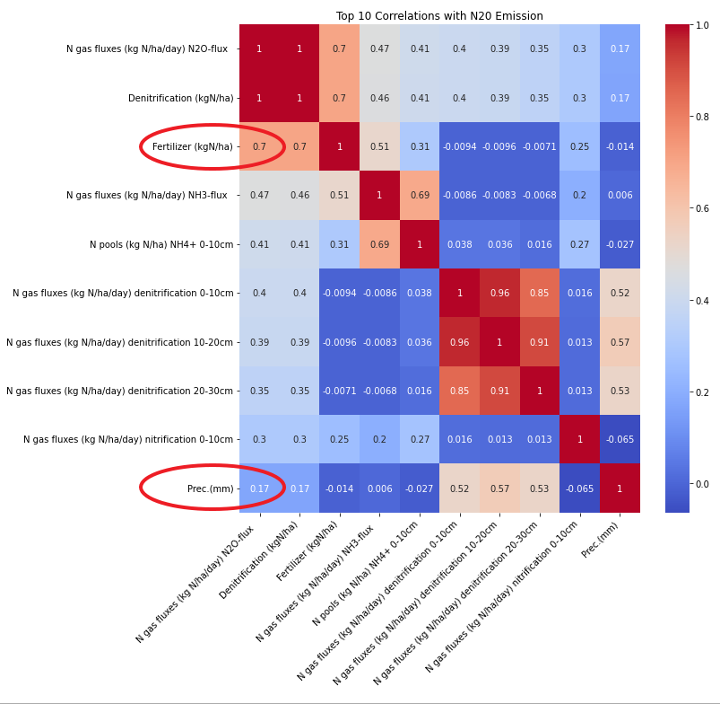
Figure 7: Top 10 correlations with N₂O emission from DNDC output. Fertiliser application rate (circled in red) is the strongest external predictor at 0.7; precipitation contributes a secondary signal of 0.17. Near-perfect co-correlation of denitrification rates across soil depths confirms internal biochemical consistency.
The fine-tuned KGML-Ag model captured both drivers well. Validation R² of 0.89, with training R² of 0.90, represents a meaningful improvement over the pre-trained baseline of 0.77 and confirms that the two-stage training strategy generalises rather than memorises. K-fold cross-validation revealed one fold in which training loss decreased. In contrast, validation loss plateaued, a mild overfitting signal that early stopping and adjusted dropout rates can address in future iterations.
Three limitations constrain the current results. DNDC synthetic pre-training data contain no negative N₂O flux values, whereas field instruments can record them under low-temperature, high-moisture conditions. Pre-training also covered only wheat and corn, so performance on other crop types has not been tested on data beyond the fine-tuning set.
Most critically, R² = 0.89 is a validation result, not a test result. A formal held-out test set is required before these metrics can justify any production deployment. Three DNDC input assumptions also carry forward: atmospheric NH₃ was estimated from the UK national average, CO₂ from a global average, and nitrogen inhibitors were not modelled, despite their presence in some AEDA treatments.
A separate workstream predicted nitrogen application rates from Sentinel-2 spectral indices using XGBoost and AutoML, achieving k-fold R² values above 0.99 and RMSEs of 3.5-4.1 kg/ha. The team traced the inflated performance to two causes: training data concentrated in the 180-200 kg/ha range, and a two-year mismatch between spectral imagery (2020) and nitrogen application records (2022).
The model has not been validated against RB209 agronomic recommendations and is not ready for site-specific deployment. Identifying this overfitting, tracing it to the data structure, and deferring deployment are the practices that distinguish responsible AI development.
From Model Output to Farm Decision
Outputs like these give farmers and advisors something they have not had before: a predicted emissions profile for each field, updated week by week through the growing season.
A farmer planning a spring nitrogen application can check whether predicted soil moisture for that week puts the timing in a high-loss window and shift the application by a few days to drier conditions, when more nitrogen is absorbed by the soil rather than lost to the air as N₂O, helping improve crop productivity and long-term food security. The decision takes minutes; the emissions savings can be significant.
A farm carbon advisor managing multiple holdings can use the field-level map to identify which fields are consistently high-emitting and prioritise them first for nitrogen management changes, rather than applying the same prescription across all fields regardless of their actual emissions profiles. That kind of targeting is not possible with a national average emission factor.
About the Project
Omdena led this project on agricultural emissions monitoring, bringing together data scientists, agronomists, and biogeochemical modelling specialists. The team worked across four parallel streams: AEDA ground truth integration, DNDC synthetic data generation, KGML-Ag model pre-training and fine-tuning, and Agronomist AI chatbot development. Delivering across all four streams simultaneously required integrating remote sensing, soil science, and deep learning under a single collaborative structure.
If you are working on agricultural emissions monitoring, soil-based greenhouse gas accounting, or looking to apply knowledge-guided machine learning to agronomic systems, reach out to the Omdena team to discuss how this methodology applies to your context.