AI Predictive Maintenance for Solar Sites: Reduce Downtime and O&M Costs
10 min readUpdated July 1, 2026
Omdena
An O&M manager at a 75 MW solar site receives an inverter failure alert on a Tuesday morning. The unit has been offline for six hours. The failure shows no prior fault flags in the monitoring system. A review of the operating data shows the degradation had been developing for three weeks. The scheduled inspection that would have caught it was still four weeks away.
Inverter failures are the largest corrective maintenance cost at utility-scale solar sites, and most are preceded by detectable degradation signals weeks before shutdown. According to NREL O&M benchmarking, unplanned repair costs significantly more than a planned replacement of the same component. That gap is not a materials cost. It is emergency labour, expedited parts, and lost generation for every offline hour.
This article covers how AI predictive maintenance works, why scheduled and reactive O&M consistently misses the failure window, which equipment produces the most cost reduction, and where the return on a condition-based maintenance programme is fastest.
How AI Predictive Maintenance Works
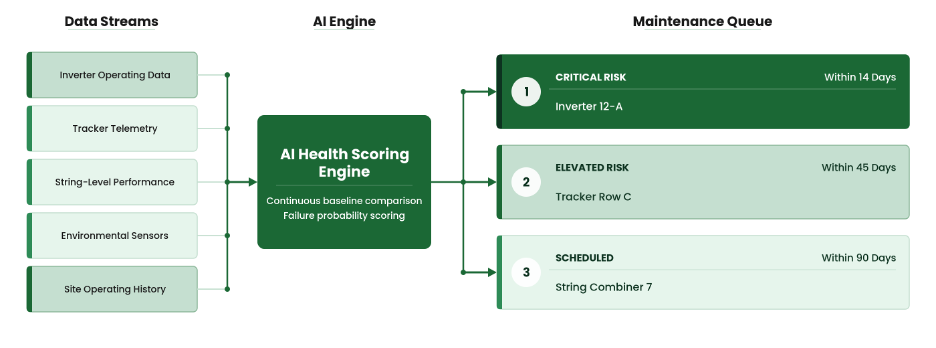
AI predictive maintenance replaces fixed inspection schedules with a continuously updated health model per component. The model reads inverter data, tracker telemetry, string-level performance, and environmental inputs, comparing against each asset’s baseline. When a component deviates in a way associated with failure, it is flagged. Each update cycle is a health check; no inspection required.
How AI Predictive Maintenance Works
Each component type has characteristic failure signatures visible in the data weeks before shutdown. Inverter capacitor degradation shows as rising ripple current and efficiency drift. IGBT wear appears as temperature deviation under load. Tracker motors show increasing drive current as they degrade. The model learns these patterns and assigns a failure probability score to each component.
When a component’s score crosses a threshold, the model issues a maintenance recommendation with a time-to-failure window. Work orders are ranked by risk: failure probability within 14 days takes priority over lower risk within 60. Maintenance teams receive a ranked schedule targeting the highest-risk components first. The result is a programme organised around condition, not calendar dates.
Why Scheduled and Reactive Maintenance Falls Short
Every solar site generates enough operating data to detect most component failures weeks in advance. Almost none of them are reading it that way. Calendar-based inspections and reactive repair on alarm were designed before continuous monitoring was practical; they remain in use not because they are optimal, but because their true cost rarely appears on a single maintenance invoice.
Scheduled Inspections Arrive Too Late
A component scheduled for inspection in week 12 can begin degrading in week 6. Without a system reading it continuously, no action is taken and by week 10 it may be at high failure risk. For inverters, the window between detectable degradation and failure averages two to six weeks, precisely the gap a quarterly schedule cannot close.
Reactive Maintenance Compounds the Cost of Every Failure
When a component fails undetected, the total cost extends beyond the repair: emergency dispatch, parts at short notice, and lost generation for every hour offline. A planned replacement triggered by a predictive alert typically costs 30 to 50 percent less than an emergency repair, consistent with IEA-PVPS O&M data. Parts are staged, dispatch is scheduled, and the maintenance window is chosen to minimise generation impact.
Component Degradation Does Not Follow a Calendar
Degradation rates vary by component type, environment, and batch; two identical inverters can follow different trajectories within 18 months. A fixed schedule applies the same attention regardless of health, spending budget on units that do not need it while missing the ones that do. Condition-based maintenance driven by actual data cuts that waste.
The Equipment AI Monitors: Why Inverters Come First
The cost reduction from AI predictive maintenance is not distributed evenly across the equipment stack.
Category
Scheduled
Reactive
AI Predictive
Detection Timing
Fixed inspection cycle
After failure occurs
2–6 weeks before failure
Avg Downtime per Event
Planned window only
12–48 hrs unplanned
Minimal — planned window
Cost per Failure Event
Inspection cost only
Full repair + emergency dispatch
Planned replacement only
Annual Maintenance Spend
Fixed regardless of health
Unpredictable, spikes on failure
Optimised to actual component risk
Component Lifespan
No active management
Shortened by reactive stress
Extended through early intervention
Inverters: Weeks of Warning Before a Failure Most Sites Miss
Inverters carry the highest failure cost at most solar sites, and their degradation signatures are among the most detectable. Capacitor ageing shows in efficiency curves, IGBT thermal stress in temperature data, and cooling system wear in operating trends. According to NREL reliability data, these signals are detectable two to six weeks before failure in most cases. AI monitoring reads them continuously; scheduled inspections typically do not.
Trackers, Cables, and Combiners: The Silent Cost Drains
Single-axis tracker failures reduce generation without triggering a fault alarm, since panels continue producing at a reduced rate. Cable insulation and combiner box failures follow the same pattern: detectable in performance data, invisible to fixed-schedule inspection. AI monitoring tracks each tracker row, cable circuit, and combiner independently; at sites where soiling also reduces tracker output, both failure modes appear in the same data stream.
Panel-Level Degradation: Beyond What Fault Detection Catches
Where solar fault detection identifies active failures, predictive maintenance extends further: tracking how quickly panels and strings lose efficiency, and forecasting when they cross a replacement threshold. A panel degrading at twice the expected rate can be scheduled before it affects string performance. This is maintenance planning driven by data, not by age.
Real-World Results: What AI Predictive Maintenance Delivers at Scale
Across utility-scale and commercial and industrial deployments, AI predictive maintenance consistently reduces unplanned downtime, lowers per-event repair costs, and extends component lifespan beyond manufacturer baselines. Two deployments illustrate what the shift from reactive to predictive looks like in practice.
75 MW Utility-Scale Site: Unplanned Inverter Failures Eliminated in Year One
At a 75 MW solar facility running central inverters, the site had experienced three unplanned inverter shutdowns in the previous 18 months, each requiring emergency dispatch and averaging 22 hours of unplanned downtime per event. The maintenance programme was calendar-based, with quarterly inspections that were consistently arriving after degradation had already progressed to the critical stage.
AI predictive maintenance was deployed across all inverters and combiner circuits. Four maintenance alerts fired in year one for inverters showing early-stage degradation, all resolved through planned replacement before failure. Unplanned inverter shutdowns in year one: zero. Annual corrective maintenance cost fell by 41 percent, with platform cost recovered within 7 months.
8 MW C&I Site: Tracker and Cable Faults Caught Before Revenue Impact
At an 8 MW commercial and industrial site operating in a high-temperature environment, tracker actuator wear and cable insulation degradation had been contributing to a pattern of intermittent underperformance that existing monitoring attributed to weather variation. The site had no structured predictive maintenance capability, and the performance losses were not triggering fault alarms.
AI monitoring identified tracker row degradation and cable insulation irregularities across three circuits within 60 days of deployment. Targeted replacements were completed in a single planned maintenance window. Generation output stabilised at 6 percent above baseline. Planned replacement cost was 34 percent lower than equivalent reactive repair, with platform payback within 5 months.
Where the Return on AI Maintenance Is Fastest
AI predictive maintenance cuts deepest at sites where components operate under elevated stress. High-temperature environments accelerate capacitor and semiconductor degradation in inverters, compressing the window between detectable degradation and failure. Sites in hot climates with high inverter density show the clearest payback from condition-based maintenance.
Operational age compounds the same dynamic. Assets five or more years into operation carry higher failure probability across most component types, and maintenance cost per MW typically exceeds the fleet benchmark. The gap between reactive spend and a condition-based programme is widest at older sites, meaning the platform payback is fastest where the existing approach is most inefficient.
Scale adds a third dimension. A utility-scale site running 200 or more string inverters cannot monitor each unit manually with any practical frequency; the field labour cost alone makes it prohibitive. AI monitoring covers every unit continuously, giving each inverter the equivalent of a daily condition check without adding headcount. Sites also running BESS optimization share the same inverter data infrastructure, with no additional integration required.
Deploying AI Predictive Maintenance: What Integration Looks Like
AI predictive maintenance integrates with the solar performance monitoring and SCADA infrastructure most sites already run. It does not require new sensors. The platform reads existing data streams: inverter data, tracker telemetry, string-level performance, and environmental sensors. Health baselines build from first connection, and initial recommendations typically appear within two to four weeks.
Audit your failure and downtime history. Pull the last two to three years of corrective maintenance records and map each failure event against component type, downtime duration, repair cost, and whether it was detected before or after shutdown. This establishes the cost baseline the AI platform will measure improvement against.
Confirm your data infrastructure. AI predictive maintenance requires inverter operating data at 15-minute resolution, tracker telemetry, string-level performance metrics, and site environmental data. Most sites with existing SCADA or energy management systems have all required feeds already available without additional hardware.
Baseline component health before optimisation begins. Allow two to four weeks of data collection before the AI model begins issuing maintenance recommendations. This period establishes the site-specific health baselines the model uses to distinguish normal operating variation from genuine degradation signals.
Configure failure probability thresholds by component type. Set the risk thresholds that trigger a maintenance work order for each component category. Thresholds should reflect the lead time required to source parts and schedule a field team, not just the probability score in isolation.
Connect predictive alerts to your O&M scheduling workflow. A predictive alert that lands in a dashboard without connecting to the team that schedules maintenance visits does not prevent a failure. Confirm the alert-to-work-order path is operational before the platform goes live.
Sites that run AI predictive maintenance alongside AI yield forecasting build a complete asset picture: generation revenue on one side, maintenance cost on the other. Planned maintenance windows feed into the yield forecast, improving accuracy; peak generation periods are factored out of the maintenance schedule. The two systems share data infrastructure and improve each other’s output over time.
Conclusion: Maintenance Should Prevent Failure, Not Respond to It
Every unplanned failure is a failure the data saw coming. The degradation was measurable and the window to intervene existed. The downtime, the emergency repair costs, and the lost generation were not inevitable. Scheduled inspections and reactive callouts are built around the assumption that failures cannot be anticipated. For most solar equipment, that assumption is wrong.
Solar assets degrade continuously. The only variable is whether that degradation is being read and acted on before it becomes a failure, or discovered after the site has already gone offline. Operators running AI predictive maintenance are not doing something sophisticated. They are simply reading the data that every site is already generating, and acting on it before it is too late.
Omdena deploys AI predictive maintenance for solar operators and asset managers, covering inverters, trackers, and the full equipment stack across utility-scale and C&I sites. To find out what your current maintenance programme is costing your portfolio, get in touch with the Omdena team.
FAQ
How far in advance can AI predictive maintenance detect an inverter failure?
For inverters, the typical detection window is two to six weeks before a failure event, depending on the failure mode and operating environment. Capacitor and IGBT degradation signatures are typically visible three to five weeks out. Cooling system failures tend to develop faster, with detectable signals appearing one to two weeks before shutdown.
Does AI predictive maintenance require new sensors or hardware?
No. Most operating solar sites already have the data infrastructure the platform requires. It reads existing inverter operating data, tracker telemetry, string-level performance metrics, and environmental sensors through current SCADA and monitoring connections. New hardware is not required in the majority of deployments.
How quickly does AI predictive maintenance start delivering results?
Initial health baselines are established within two to four weeks of data connection, and first maintenance recommendations begin appearing shortly after. The full value is measurable after the first avoided failure event, which typically occurs within three to six months at sites with aging equipment or known reliability issues.
Can AI predictive maintenance reduce inverter replacement costs?
Yes. A planned replacement triggered by a predictive alert typically costs 30 to 50 percent less than an emergency repair of the same component. Emergency dispatch fees, premium parts sourcing, and lost generation during unplanned downtime are all eliminated when the maintenance window is scheduled in advance.
Which components benefit most from AI condition monitoring?
Inverters deliver the highest cost reduction from AI condition monitoring because they carry the highest repair cost per event and have the most detectable degradation signatures. Single-axis trackers, string combiners, and cable circuits follow, particularly at sites in high-temperature or high-soiling environments where component stress is elevated.
Share this article
Share on LinkedIn, send by email, or copy the direct link.