A 75 MW portfolio in Southern Europe ran standard threshold-based monitoring for four years, with performance ratio consistently within the normal operating range. An AI performance monitoring platform identified 18 percent generation loss hidden across tracker misalignment, string faults, and progressive soiling. Targeted maintenance recovered it within two operating quarters.
The generation was always being lost. Standard monitoring could not see it. Every fault was operating below the alert thresholds the system was configured to detect, quietly consuming revenue the asset was capable of producing but failing to deliver.
This article covers what AI performance monitoring does, where the 1- 3% loss comes from, and what recovery looks like at scale. The patterns described are representative of what operators consistently find when AI monitoring is deployed on portfolios that have been running on standard threshold-based systems.
How AI Performance Monitoring Works: Beyond Standard Monitoring
When an inverter trips or a string goes offline, standard monitoring catches it. Most generation losses sit just below those thresholds, compounding into serious revenue shortfalls across an operating year without triggering a single alert. AI performance monitoring builds a machine learning model of expected output given real-time irradiance, temperature, and site conditions. Trained on real operating data, it flags deviations at the string and panel level, including losses that standard monitoring treats as normal variation.
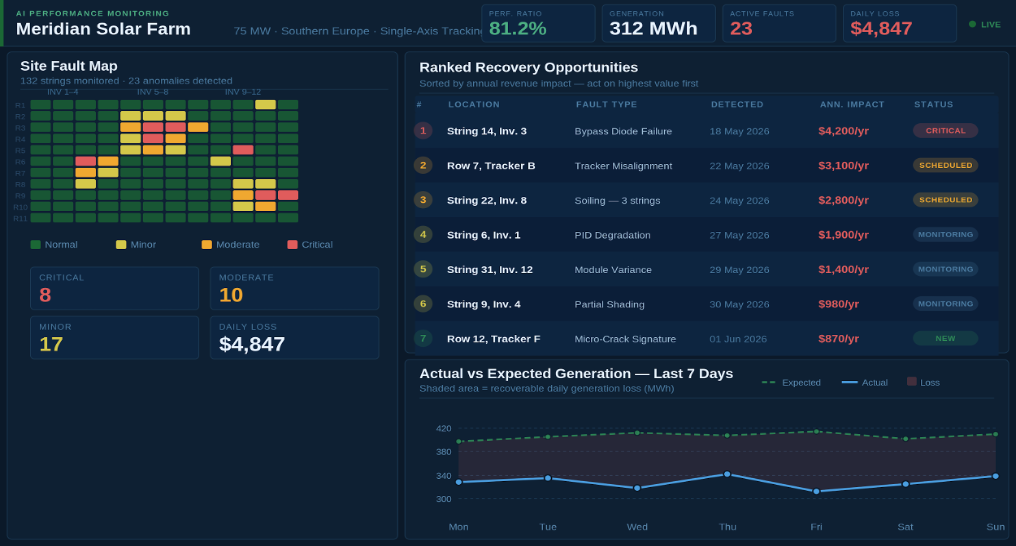
Granularity is what makes detection meaningful. A single underperforming string in a 20-string inverter reduces output by 5 percent, well within the acceptable variation range of standard monitoring. AI monitoring resolves that loss to the specific string. It returns a ranked list of generation losses, each mapped to a precise location and expressed in dollar terms, as the asset fails to produce.
Detection speed is where the difference becomes quantifiable. According to published research in Applied Energy, AI-based monitoring detects losses an average of 14 days earlier than threshold-based systems. On a 50 MW portfolio, that gap across multiple active faults represents weeks of recovered generation worth tens of thousands of dollars annually.
The 10–30% Generation Loss AI Monitoring Finds
Research from the National Renewable Energy Laboratory estimates that 10 to 30 percent of energy generation in operating solar assets is lost to causes that standard monitoring does not flag. Below is what AI monitoring consistently uncovers across operating portfolios, expressed as a share of total annual generation.
3 to 8 percent of annual generation is lost to soiling and dust on most sites. The loss is gradual and consistent, so it never crosses the alert threshold. AI monitoring detects it by comparing string-level output degradation with irradiance data and identifying the point at which cleaning delivers a measurable revenue return.
Up to 15 percent of total generation shortfall on large portfolios comes from sub-threshold string faults. A string running at 85 percent capacity due to a degraded bypass diode does not trigger an inverter alarm. When multiplied across hundreds of strings, these individually small losses add up to the largest single recoverable source on most operating sites, becoming the primary target of AI-based fault classification models.
2 to 5 percent per affected row is the generation penalty for tracker misalignment on single-axis systems. Misaligned rows keep operating at lower output than their position should deliver, with no fault condition firing. AI monitoring identifies them by comparing output against adjacent rows under identical irradiance conditions.
AI monitoring detects PID degradation and micro-crack propagation 6 to 12 weeks earlier. Both develop gradually over months, invisible to standard monitoring until they affect full string output. Catching them earlier stops the compounding before it becomes significant.
0.5 to 0.8 percent per year is the average module degradation, but degradation is not uniform. Modules are degrading faster than the site’s average drag string performance below fault thresholds. AI monitoring surfaces accelerated degradation patterns early, before they become an unplanned replacement emergency.
These are the losses AI monitoring finds on almost every operating portfolio it is deployed on.
The Recovery ROI: What AI Monitoring Returns in Practice
On a 10 MW site losing 15 percent of generation, recovering half returns $90,000 to $130,000 in additional annual revenue at a 20 percent capacity factor and $60 per MWh. Annual monitoring costs at that scale range from $2,000 to $8,000, less than 5 percent of the recovery value. The table below shows how returns scale across portfolio sizes.
Beyond direct generation recovery, Wood Mackenzie’s industry analysis estimates that AI-guided maintenance reduces O&M costs by 15 to 25 percent across operating portfolios. Maintenance teams working from a ranked fault list spend less time searching and more time repairing, lowering total costs while improving output.
The return compounds beyond year one. Each monitoring cycle produces a more accurate fault baseline. Maintenance sequencing improves as the model learns site-specific degradation patterns. The recovery does not flatten. It grows as the platform matures on the asset.
Which Solar Portfolios Have the Most to Recover
If your site has been operating for two to seven years, it is in the window where manufacturing defects, thermal cycling damage, and early tracker wear accumulate below monitoring thresholds. Performance appears stable on the dashboard while the underlying fault load builds. This age range consistently produces the highest recovery volumes when AI monitoring is deployed.
If your performance ratio is more than 3 percent below design and the cause is unexplained, sub-threshold faults are almost certainly responsible. If your monitoring is at the inverter level only, every loss source in Section 2 is invisible to your system. Soiling, string faults, tracker misalignment, and module degradation all operate below the threshold at which standard monitoring fires.
Multi-site portfolios and remote or floating solar assets further amplify returns. AI monitoring standardises performance data across all sites, enabling ranking of recovery opportunities by expected revenue rather than by which asset is most convenient to service.
How to Deploy AI Monitoring on Your Operating Portfolio
AI performance monitoring connects to existing monitoring and inverter data without replacing current infrastructure. The most effective approach starts with the highest-loss assets identified in Section 4 and builds from there.
- Start with your underperforming sites. Pull 12 months of performance ratio data and flag sites running below design estimate or showing unexplained variance. Assets two to seven years old and sites on inverter-level monitoring only should be first. These carry the most recoverable generation.
- Choose a platform that outputs ranked revenue losses rather than anomaly scores. A platform that tells you string 14 on inverter 3 is costing $4,200 per year in lost generation is immediately actionable. A platform that returns an anomaly confidence score requires another step before a maintenance team can act on it.
- Run 30 to 60 days of parallel monitoring before acting on outputs. This baselining period calibrates the model to actual site irradiance and environmental conditions, validates detections against known faults, and produces a reliable starting point for the first maintenance cycle.
- Repair in order of revenue impact, not convenience. Work down the ranked fault list rather than starting with whatever is geographically easiest. Measure performance ratio improvements after each cycle and track cumulative recovery relative to monitoring costs to build an internal ROI record.
Each cycle builds on the last. The baseline becomes more accurate, the fault patterns become clearer, and the recovery compounds with every quarter the platform runs.
Conclusion: The Generation Loss AI Monitoring Stops
Most operating solar assets are losing generation right now that their monitoring systems cannot see. The soiling accumulating across strings, the bypass diodes degrading below alarm thresholds, the tracker rows producing less than their position should deliver. None of it appears on a standard monitoring dashboard. All of it appears in an AI monitoring report.
The 10 to 30 percent figure is not a theoretical ceiling. It is what operators consistently find when they move from threshold-based monitoring to AI-powered detection on assets they believed were performing normally. The generation is there. The monitoring gap is what is hiding it.
Omdena works with solar operators and asset managers to deploy AI performance monitoring across portfolios of all sizes. Our agentic AI platform delivers string-level fault detection and revenue-ranked recovery reports at a fraction of typical development costs. If you are ready to find out what your portfolio is actually losing, get in touch with the Omdena team.