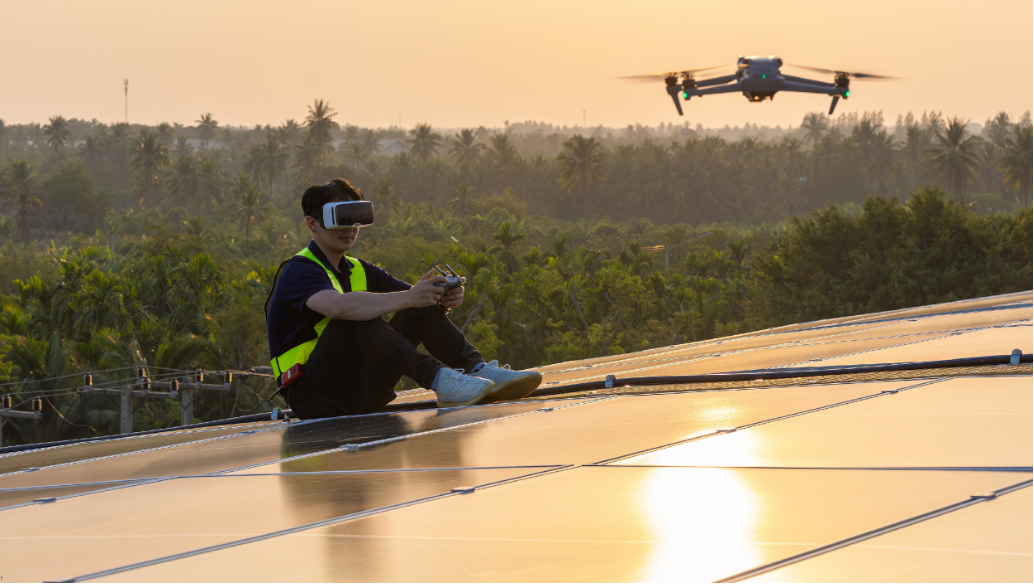
A solar operator managing a 50-MW portfolio in Southeast Asia conducted manual thermal inspections every six months. Each inspection took three weeks, cost over $40,000, and came back clean. An AI-powered drone survey covered the same portfolio in two days and flagged 214 panels with active faults that had accumulated for up to 14 months.
The gap between what manual inspection costs and what it actually delivers is wider than most operators realise. Budgets get approved, inspections get completed, and reports come back clean. Meanwhile, hidden panel faults continue compounding below the detection threshold.
This article breaks down the real costs of both approaches at the numbers level, so operators and asset managers can make an accurate comparison and decide where the value lies for their portfolio.
Manual vs. AI Solar Inspection: Coverage, Cost, and What Each Approach Misses
Manual solar inspection relies on trained technicians walking panel rows with handheld thermal cameras, performing visual inspections, and conducting periodic string-level electrical testing. It catches obvious visible damage. The limitations emerge at scale and at the level of subtle, developing faults.
Coverage speed is the first constraint. A trained technician can cover roughly 1-2 MW per day on foot using a handheld thermal camera. On a 50 MW site, that is 25 to 50 working days per full inspection. Most operators run one or two inspections per year, which means faults developing between cycles go undetected for months.
Accuracy is the second constraint. Results depend on the individual technician, equipment quality, and conditions on the day. Inter-inspector variability is high. Subtle faults, including early-stage PID degradation, micro-cracks, and partial soiling, are routinely missed until they grow large enough to produce a visible thermal anomaly.
AI-powered drone inspection covers 50-100 MW per day, capturing thermal images of every panel during peak solar hours. Those images are processed by machine learning models trained on thousands of confirmed fault examples, which classify each anomaly by type and severity and map its precise on-site location.
The output is a ranked fault report delivered within 24 to 72 hours, ready for the maintenance team to act on immediately. According to published research in IEEE Transactions on Energy Conversion, AI-based fault classification reaches above 94 percent accuracy, substantially higher than manual thermal review and consistent across sites and conditions.
Solar Inspection Cost Comparison: Manual vs. AI at 10, 50, and 100 MW Scale
The cost difference between manual and AI-powered inspection grows significantly with portfolio size. The table below uses current industry benchmarks: manual inspection at $800 to $1,200 per MW in combined labor, equipment, and reporting costs, and AI drone inspection at $150 to $500 per MW, including thermal imaging and automated fault classification.
| Manual 10 MW | AI 10 MW | Manual 50 MW | AI 50 MW | Manual vs AI 100 MW | |
|---|---|---|---|---|---|
| Cost | $8K-$12K | $1.5K-$5K | $40K-$60K | $7.5K-$25K | $80-120K vs $15-50K |
| Coverage Speed | 5-10 days | Hours | 25-50 days | 1-2 days | 50-100 days vs 2-3 days |
| Fault Detection Accuracy | 60-75% | 94%+ | 60-75% | 94%+ | 60-75% vs 94%+ |
| Report Turnaround | 1-2 weeks | 24-72 hrs | 3-6 weeks | 24-72 hrs | Weeks vs 24-72 hrs |
| Faults Missed | Early-stage PID, micro-cracks, partial soiling | Very few at >94% accuracy | Early-stage PID, micro-cracks, partial soiling | Very few at >94% accuracy | Manual misses subtle faults consistently |
The cost gap widens as portfolio size increases, but even at 10 MW, the economics clearly favour AI inspection. The speed advantage is the often-overlooked factor: a fault detected and repaired three weeks earlier means three fewer weeks of lost generation. On a 10 MW site with a 3 percent active fault rate, that timing difference alone is worth thousands of dollars in recovered output.
The Real ROI of AI Solar Inspection: What a Missed Fault Actually Costs You
The cost of an inspection is visible and easy to budget. The cost of a missed fault is invisible and significantly larger. Most operators account for inspection spend but not for the revenue lost to undetected faults in their operating assets.
Research from the National Renewable Energy Laboratory estimates that 10 to 30 percent of energy losses in operating solar assets go undetected by standard monitoring. On a 10 MW site, the midpoint of that range represents $120,000 to $180,000 in unrecovered revenue per year. It is the revenue the asset is capable of generating but is not producing.
A single AI drone survey on a 10 MW site costs $1,500 to $5,000. Recovering 3 to 4 percent of lost generation returns $50,000 to $90,000 in additional annual revenue. Industry analysis from Wood Mackenzie estimates AI-guided maintenance reduces O&M costs by 15 to 25 percent across operating portfolios, compounding the return well beyond the survey cost.
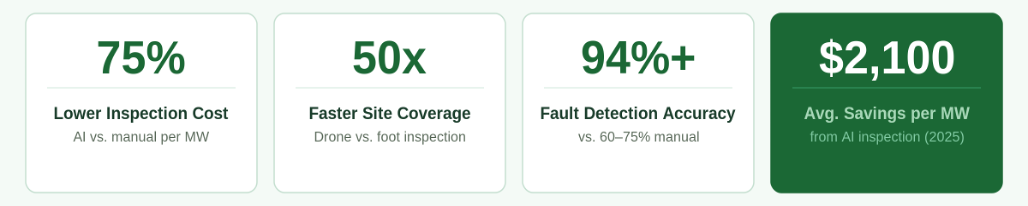
The payback math is straightforward. The inspection cost is a one-time expense per cycle. The fault-related revenue loss runs continuously until the fault is found and fixed. Every week of delay between a fault developing and a maintenance crew reaching it is a week of output that the asset will never recover. Drone inspection data from Raptor Maps shows operators saved an average of $2,100 per MW inspected in recovered generation, across a global portfolio of assets surveyed in 2025.
Which Solar Sites Benefit Most from AI-Powered Inspection
AI-powered drone inspection delivers the highest return in specific scenarios. Understanding which site characteristics produce the strongest ROI helps operators prioritise where to deploy it first.
Utility-scale and large commercial rooftop assets above 5 MW are where the economics are clearest. Manual inspection at this scale is slow, expensive, and inconsistent. A single AI survey covers the full site in hours and returns a ranked fault report before a manual inspection team would have finished the first string.
Multi-site portfolios benefit from the ability to objectively compare performance across assets. AI inspection produces standardised fault data across every site in a portfolio, enabling ranking of maintenance priorities by expected generation recovery rather than by which site is loudest or most convenient to service.
Sites running more than 3 percent below design performance ratio are already showing the financial impact of undetected faults. An AI survey pinpoints exactly which panels are responsible and ranks them by revenue impact, turning a vague underperformance signal into a precise list of maintenance actions.
Assets two to six years old are the highest-priority candidates. This is the window when manufacturing defects, thermal cycling damage, and early-stage PID degradation begin to appear consistently below standard monitoring thresholds. These faults look like normal performance variation until AI inspection reveals the underlying cause.
The same logic applies to floating solar installations and ground-mounted assets in remote locations, where the access cost of manual inspection makes AI-powered drone surveys even more economically compelling.
How to Get Started with AI Solar Inspection at Your Site
Switching to AI-powered inspection does not require replacing existing monitoring infrastructure. The most effective approach is to layer AI detection onto existing systems, starting with the highest-value assets.
- Identify your highest-risk assets first. Pull 12 months of performance ratio data and flag any site running more than 3 percent below design estimate. Prioritise assets two to six years old when manufacturing defects and early degradation begin to appear below standard monitoring thresholds. These are the sites where AI inspection recovers the most revenue.
- Schedule your first survey during peak irradiance. AI drone thermal inspections require clear skies and adequate solar irradiance to produce reliable thermal data. Late spring through early autumn provides the best conditions in most markets. A survey conducted under low-irradiance conditions may miss faults that would be clear during peak hours, so book early, as seasonal slots fill quickly.
- Act on the ranked fault report within the same maintenance cycle—the value compounds with fast follow-through. A critical fault is costing revenue every day it remains unrepaired. Sequence the work by revenue impact. A bypass diode failure at the far end of the site recovers more generation than a soiling issue near the access road, regardless of which is easier to reach.
- Track and document generation recovery. After each maintenance cycle, measure the performance ratio improvement against inspection and repair costs. This builds a clear internal ROI figure and the business case for rolling AI inspection across your full portfolio, with objective data to hold providers accountable over time.
These four steps work as a repeating cycle. Each survey builds on the last, the fault baseline grows more accurate, and the ROI compounds with every maintenance round.
Conclusion: The Inspection Budget That Pays for Itself
Manual inspection is not a cost-effective way to protect a solar portfolio at scale. It is slow and inconsistent, and it misses the developing faults that cause the most damage. The operators who are still relying on it are not saving money on inspections. They are spending more on inspection and losing more to undetected faults at the same time.
AI-powered fault detection changes the economics entirely. A single drone survey, at a fraction of the cost of manual inspection, returns a ranked, actionable fault report within 72 hours. The faults it finds and the maintenance it guides consistently return five to ten times the survey cost in recovered generation within the first year.
Omdena works with solar operators and asset managers to deploy AI-powered inspection across portfolios of all sizes. Our agentic AI platform delivers enterprise-grade fault detection at around a third of typical development costs. If you are ready to replace manual inspection with something that actually finds the faults, get in touch with the Omdena team.