
AI for Malaria Prevention: Identifying Water Bodies Through Satellite Imagery
Using Artificial Intelligence on land topography to predict Malaria infected water bodies faster and more accurately.

October 28, 2020
10 minutes read

Combining satellite images, topography data, population density and other data sources to build an algorithm that identifies the areas in which stagnant water bodies (malaria mosquito breeding sites) likely exist. The model helps to identify breeding sites quicker and more accurately.
You must have read the famous quote by Andrew Ng which highlights the importance of data in today’s world. He says, “It’s not who has the best algorithm that wins. It’s who has the most data.” The statement stands true in most of the data-driven applications, however, the required amount of data is not always available.
“Data is the new oil”- Clive Humby
If you come from the Kaggle world, then the problems of data sourcing might not be known to you. The online competitions begin with a rich corpus of data (that has been annotated and verified by large teams). But, at Omdena, our journey begins with the task of data acquisition. It is a challenging task, especially in the Social Good space, since not many tech giants are focusing on these problems, and as a result, data is not readily available for analysis and churning.
Thus, data collection from the right sources becomes a critical exercise in a machine learning project. That brings us to the Artificial Intelligence Zzapp Malaria project, a project tackled by 50 collaborators from across the world with a common objective — to provide Artificial Intelligence-driven mechanisms that detect water bodies prone to the breeding of mosquitoes in order to prevent malaria. Let me talk about how my team eventually built a productive dataset from an initially minimal one.
The Problem Statement
High-Level Objective (Omdena.com)
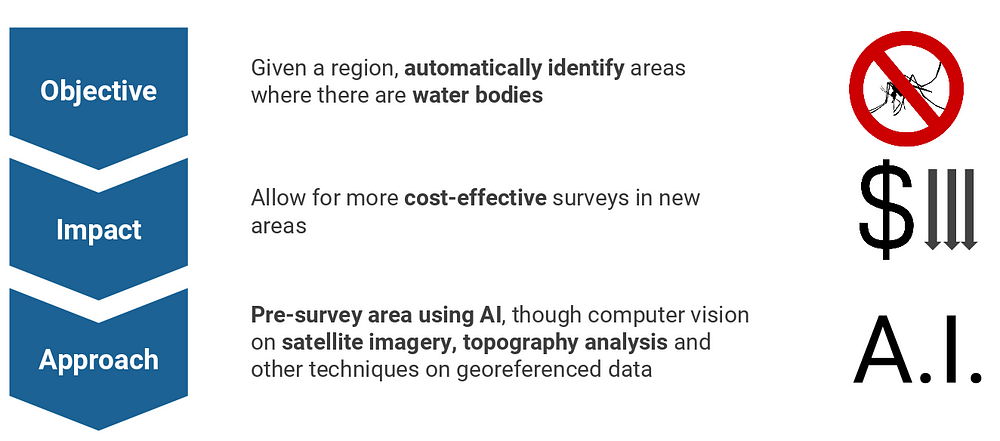
The project falls under the UN’s Sustainable Development Goal 3, which is to“ end the epidemics of AIDS, tuberculosis, malaria and neglected tropical diseases” by the year 2030. Given a region, our task was to automatically identify areas where there are water bodies. We achieved this by pre-surveying areas for malaria-infected water bodies via Artificial Intelligence tools like satellite imagery, topography analysis, and
geo-referenced data. It allows for more cost-effective surveys in new areas.
As you might have realized by now, money plays a big impact on such a project. To be able to cater to a large area like Ghana or Kenya in Africa, you need to be able to direct your resources to the most susceptible regions in the most cost-efficient manner, that too in a stipulated amount of time. The time is limited since you have to treat the water bodies before the wet season arrives, leading to a rise in mosquito breeding.
The dataset that we received was particularly for the Ghana and Amhara regions of the African subcontinent.
What’s interesting? The data did not come all at once.
Zzapp Malaria was surveying these regions during this phase hence the data came in periodic batches. The majority of the data was being sourced during the period of the project as it was a wet season in the above-mentioned areas. As an Artificial Intelligence engineer/ data scientist, you need to align your game plan to this flow of incoming information.
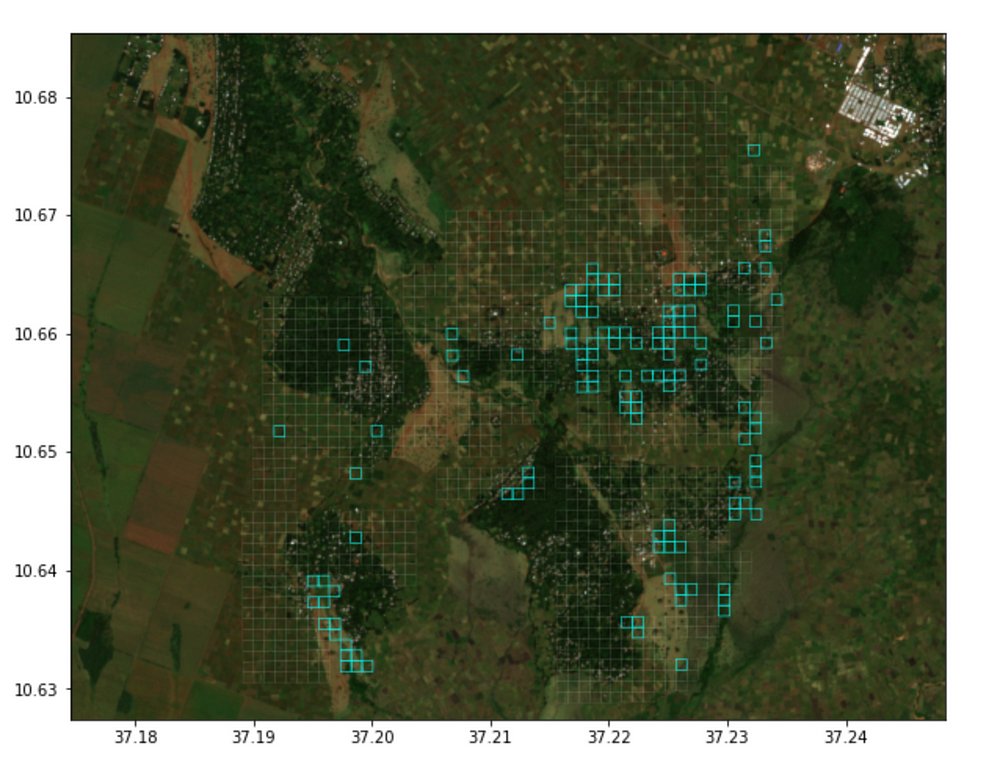
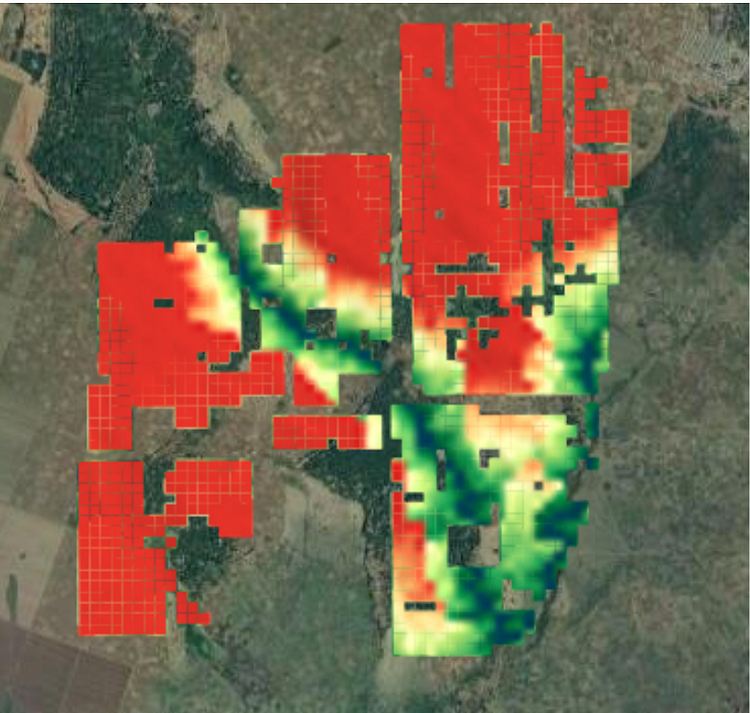
Highlighted Grids have a higher risk of containing water bodies (Omdena.com)
The dataset comprised of 3-meter resolution satellite images (each image was 100×100 meters) with labels indicating the number of natural and artificial sources of water bodies in these regions. This was based on a survey conducted by Zzapp field workers. Each image corresponded to a 100×100 MGRS (military-grade geo-co-ordinate system) grid and so we had approximately 200 grids to start with and got around 1500 images by the end of the project.
Overcoming data challenges
We had the following challenges in this project
- Lack of enough data. As explained earlier, the Zzapp data arrived in a periodic manner. Also, since not many organizations are working on data collection or using artificial intelligence for malaria elimination, there is NO pre-annotated dataset (at the time of this project) which one can download and get started with.
- Lack of high-resolution data. The dataset had a 3-meter resolution which is better than most satellite image sources but is still not as detailed as a Google Maps image.
- Imagery cannot convey the presence ( or probability of ) of water accumulation in an area. Consider, for example, water collected in a canal covered by a roof. This would be impossible to detect with satellite imagery.
How we did it
To solve the lack of data issue, we devised a two-step approach. Firstly, we detected the presence of large water bodies ( lakes, rivers, streams, ponds). This was achieved using State-Of-The-Art vision models like the DeepWaterMap which produced a probability map given a grid. This was, in itself, a useful way to trace the surrounding regions of interest. (Humans tend to settle around large water bodies).
Next, we used the output of the above model as a proxy variable to further detect the risk of water accumulating in smaller cross-sections.
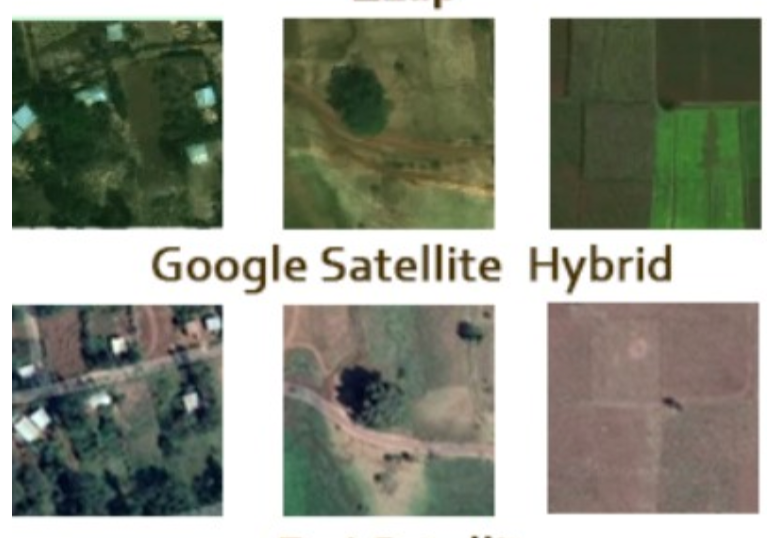
Provided images v/s Google Hybrid images (Omdena.com)
To compensate for the lack of resolution, we created a pipeline that extracts rich images from Google Satellite Hybrid service for corresponding grids given to us. You can see the difference in the details in the 3 references image on the left. You might wonder, why not use super-resolution instead? But using super-res could cause variations that would deviate from the original truth.
Further, since these images alone cannot comprehensively convey water presence, we created more features using population density, vegetation indices, topography, and landcover classifications. Let’s look at each of these factors briefly.
1. Population Density
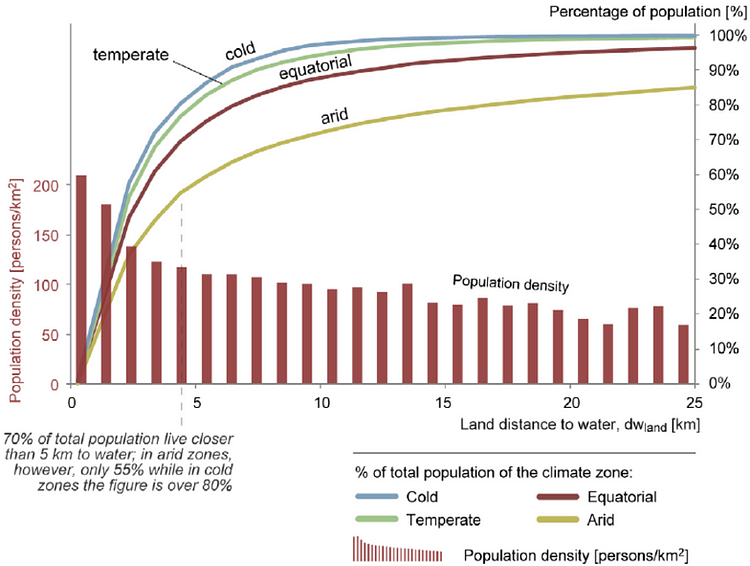
Population density v/s Land distance to water (Omdena.com)
Research suggests that as the population density in a given region rises, the land distance to water decreases. We thought of leveraging to interpret the risk of mosquito breeding grounds based on how densely populated a region is. The graph on the left roughly highlights this inverse proportionality.
2. Vegetation Indices and Height Above Nearest Drainage (HAND)
Vegetation masks calculated over the region of Ghana and Amhara (Omdena.com)
A Vegetation Index (VI) is a spectral transformation of two or more bands designed to enhance the contribution of vegetation properties and allow reliable spatial and temporal inter-comparisons of terrestrial photosynthetic activity and canopy structural variations. Dual polarised (VV and VH) Sentinel-1 Ground Range Detected (GRD) scenes were acquired from Google Earth Engine (https://earthengine.google.com/). All scenes were pre-processed using the following steps:
- Thermal noise removal,
- Radiometric calibration
- Terrain correction.
The HAND data was also exported using Earth Engine. This was used to help eliminate false positives located above the drainage line.
3. Landcover Classification
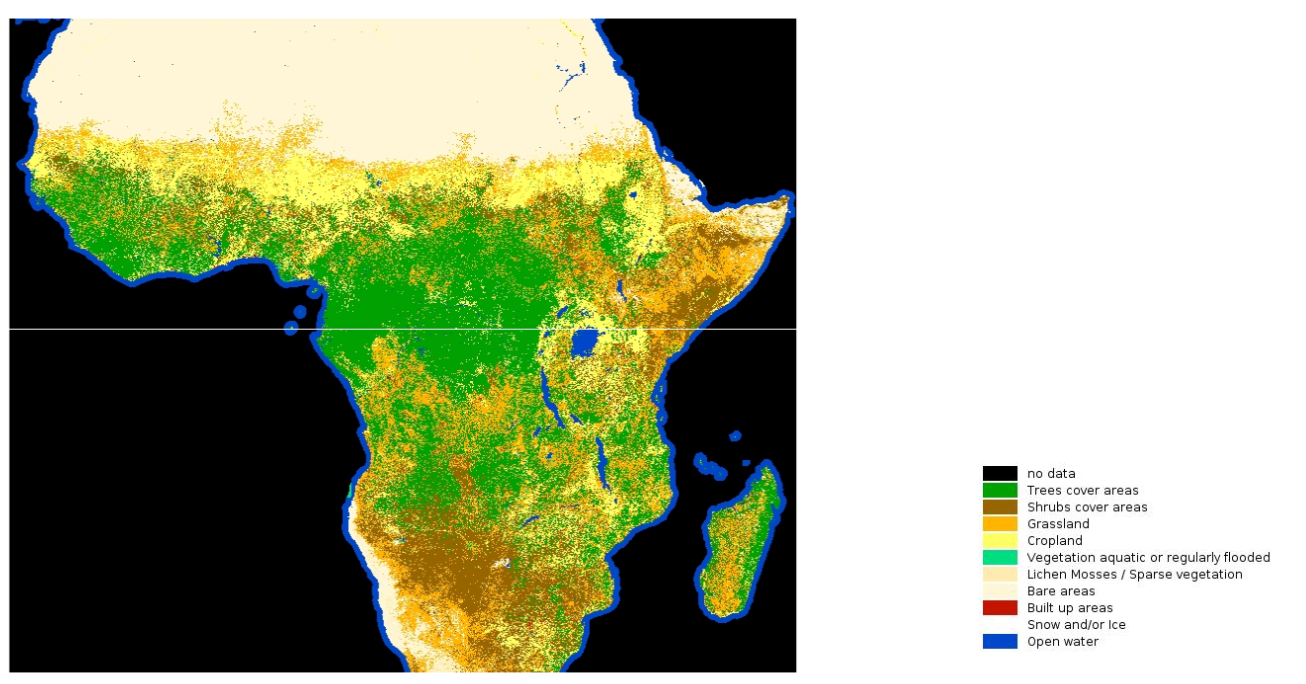
Landcover classification labels sourced from the LandCoverNet dataset (Omdena.com)
In order to gain information about the terrain, we used a labeled dataset that was specifically released for the African subcontinent. LandCoverNet is a labeled global land cover classification dataset based on Sentinel-2 data. Version 1 of the dataset contains data across the entire African continent. The dataset is labeled on a pixel-by-pixel basis where each pixel is identified as one of the 10 different land cover classes: “trees cover areas”, “shrubs cover areas”, “grassland”, “cropland”, “vegetation aquatic or regularly flooded”, “lichen and mosses / sparse vegetation”, “bare areas”, “built-up areas”, “snow and/or ice or clouds” and “open water”.
4. Topography
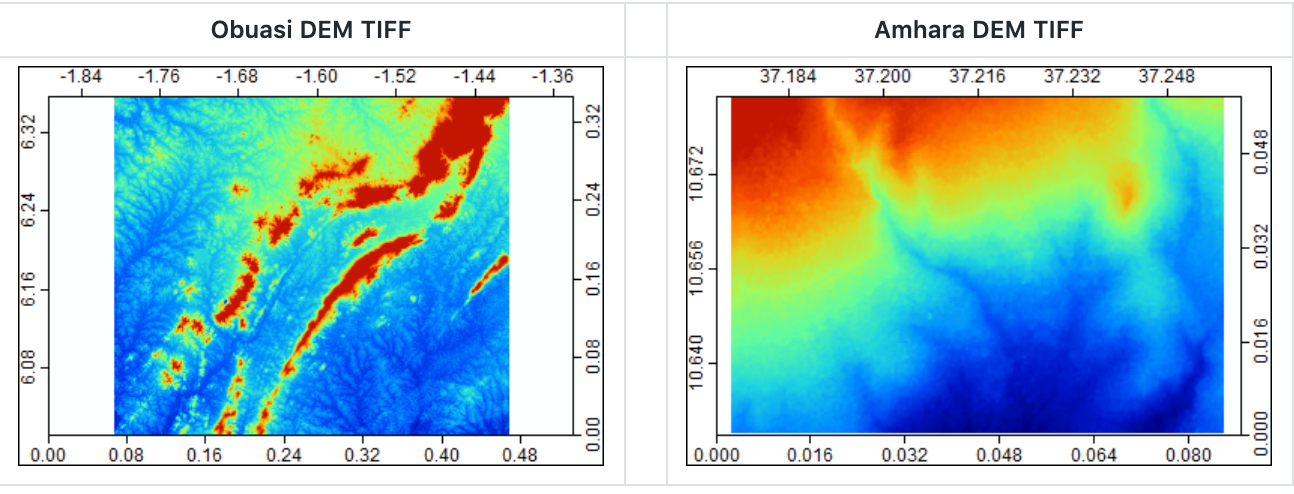
Digital Elevation Model data for Ghana and Amhara region (Omdena.com)
All the topographic features were calculated using SRTM v3 DEM (Digital Elevation Model) data. We used the SAGA API in order to pre-process the DEM dataset and generate topographic features. The DEMs were smoothed to fill in isolated elevation pits (or spikes), which typically represent errors or areas of internal drainage that interrupts the estimate of water flow. Then the following 17 topographic features were generated using the pre-processed elevation tiff:
- Relative Slope Position
- Topographic Wetness Index
- Topographic Position Index (tpi500)
- Channel Network Distance
- Convergence Index
- LS Factor
After generating raster datasets for the above topographic features, these features were projected onto the polygons of interest (positive and negative scan chunks) in Ghana and Amhara. The mean, max, and min of all the pixel values within a given grid were calculated for all of the above features to aggregate them at the MGRS grid level.
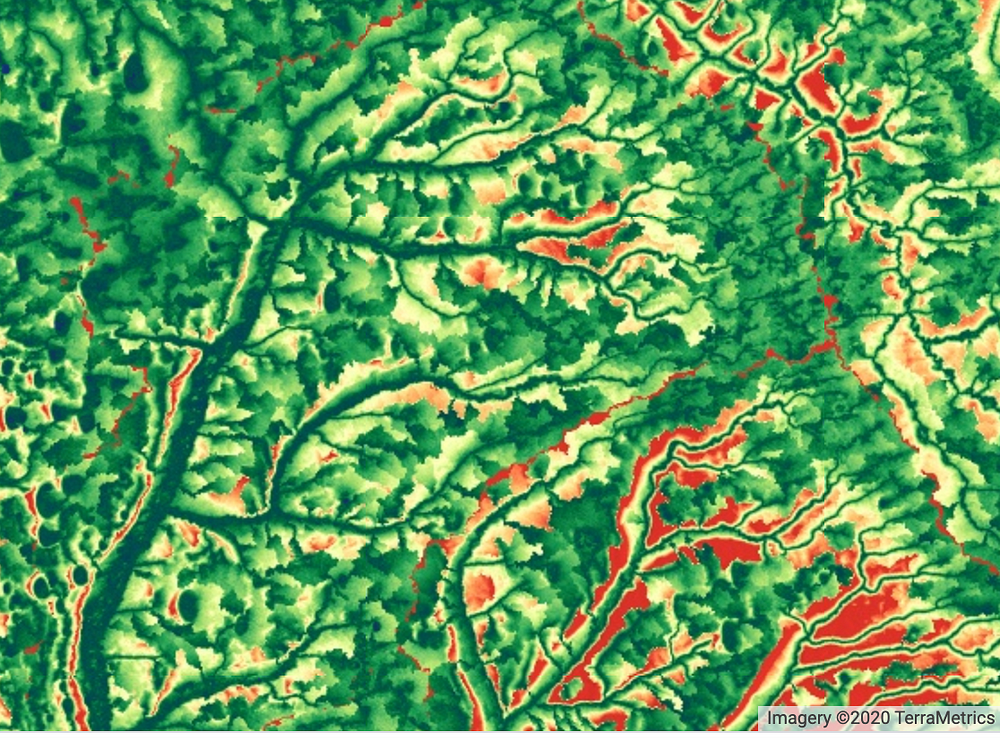
The topographic features were instrumental in detecting natural sources of water (both large and small in size) with high AUC which is evident below:
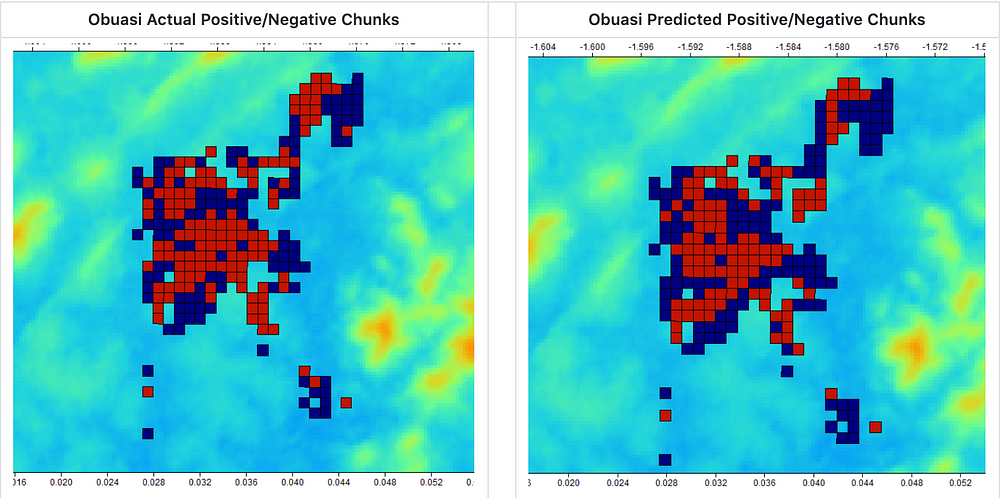
Actual v/s Predicted Labels for water bodies in Ghana Region (Omdena.com)
Bringing it all together
Using the aforementioned data sources, we ended up generating 81 features and after a round of exploratory data analysis, we were able to finalize on the top 20 most relevant features. We then set out to build and validate ensemble models that could best capture the information in each of the data sources. It allowed us to detect both natural and artificial sources of water with a high degree of recall. The higher recall was preferred since the notion of capturing all water sources was more important than inaccurately labeling some regions with having water. The data flow diagram aims to highlight this effort.
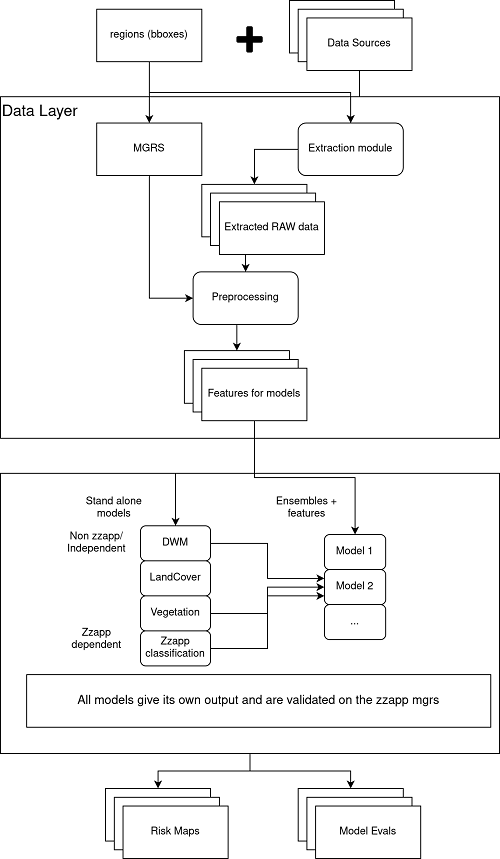
Data Flow Diagram (Omdena.com)
This article is written by Tanmay Laud.


